Using jobperf
The jobperf command provides job statistics and live monitoring tools. With
it, you can see live performance metrics for each node and GPU while a job
is running.
jobperf Command Line Usage
The basic usage is to pass in the job ID:
jobperf 1214642
This will print out summary information about the job as well as summary CPU and memory resource usage. If the job is running, it will also fetch current memory, CPU, and GPU usage for each node.
For example, here is the output for a job that has completed:
Job Summary
-----------
            Job Name:   cluster-openfoam-4x16-fdr
               Nodes:   4
     Total CPU Cores:   64
           Total Mem:   248gb
          Total GPUs:   0
  Walltime Requested:   12:00:00
              Status:   Finished

Overall Job Resource Usage
--------------------------
                                           Percent of Request
       Walltime Used   12:00:24            100.06 %
  Avg CPU Cores Used   61.42 cores         95.96 %
         Memory Used   27084840kb          10.42 %
At a glance, I can tell a few things about this job:
- 100% of walltime was used. This job didn't actually finish, it was likely killed by the scheduler. It is good to not request too much walltime, but it appears this job needed more time. If I run this again, I should bump up the walltime.
- I used 96% of requested CPU cores. This is excellent utilization. I won't have
to change
ncpusat all. - I used only 10% of my memory requests (~27GB of 248GB). It is important to give yourself a safety buffer when requesting memory (Slurm will kill jobs that reach their requested memory), but using only 10% of what was requested is wasteful. When running this job again, I should decrease the memory requests. If I use a safety margin of 50%, then that indicates my request should be for 27x1.5 = ~40GB total, or 10GB per node. Reducing this request would free up over 200GB for other users of the cluster!
When jobs are still running, the current CPU, memory, and GPU usage is displayed for each node. For example here are some results of running on a VASP job:
Job Summary
-----------
            Job Name:   vasp_gpu
               Nodes:   2
     Total CPU Cores:   4
           Total Mem:   40gb
          Total GPUs:   2
  Walltime Requested:   01:30:00
              Status:   Running

Overall Job Resource Usage
--------------------------
                                           Percent of Request
       Walltime Used   00:02:31            2.80 %
  Avg CPU Cores Used   1.03 cores          25.66 %
         Memory Used   12589808kb          30.02 %

Average Per Node Stats Over Whole Job
--------------------------
            CPU Cores                     Memory
Node        Requested   Used              Requested   Used
node0387    2           1.06 (53.12 %)    20.00 GB    6.01 GB (30.06 %)
node0284    2           1.06 (53.21 %)    20.00 GB    6.09 GB (30.47 %)

Fetching current usage...
Current Per Node Stats
--------------------------
            CPU Cores                     Memory
Node        Requested   Used              Requested   Used
node0387    2           1.01 (50.68 %)    20.00 GB    6.01 GB (30.06 %)
node0284    2           1.01 (50.69 %)    20.00 GB    6.09 GB (30.47 %)

Node        GPU Model                     Compute Usage  Memory Usage
node0387    NVIDIA A100 80GB PCIe         98.0 %         7404 MB
node0284    NVIDIA A100 80GB PCIe         98.0 %         8296 MB
From this we can tell a few things about the job:
- It is using one core on each node (2 were requested, so one core on each node is idle).
- It is making very good use of the GPUs, each GPU requested is near 100% utilization.
- It is using about 30% of memory requested. The may fluctuate over the course of the job so it may be better to wait until the job is complete before we decide we can reduce the memory requests.
You can also pass the -w option (jobperf -w <job id>). This will print all
the same information as without the -w, but it will keep requesting and
printing current per node CPU, memory, and GPU statistics.
jobperf HTTP Usage
If you'd rather look at the job stats in a web interface, you can do so with the
-http option. This is particularly useful with the -w (watch) option on jobs
that are still running:
jobperf -http -w 2977
It should print out a message like:
Started server on port 46543. View in Open OnDemand:
https://ondemand.rcd.clemson.edu/rnode/node0401.palmetto.clemson.edu/46543/
If you visit this link in your browser, you should see a screen like the following (after logging in):
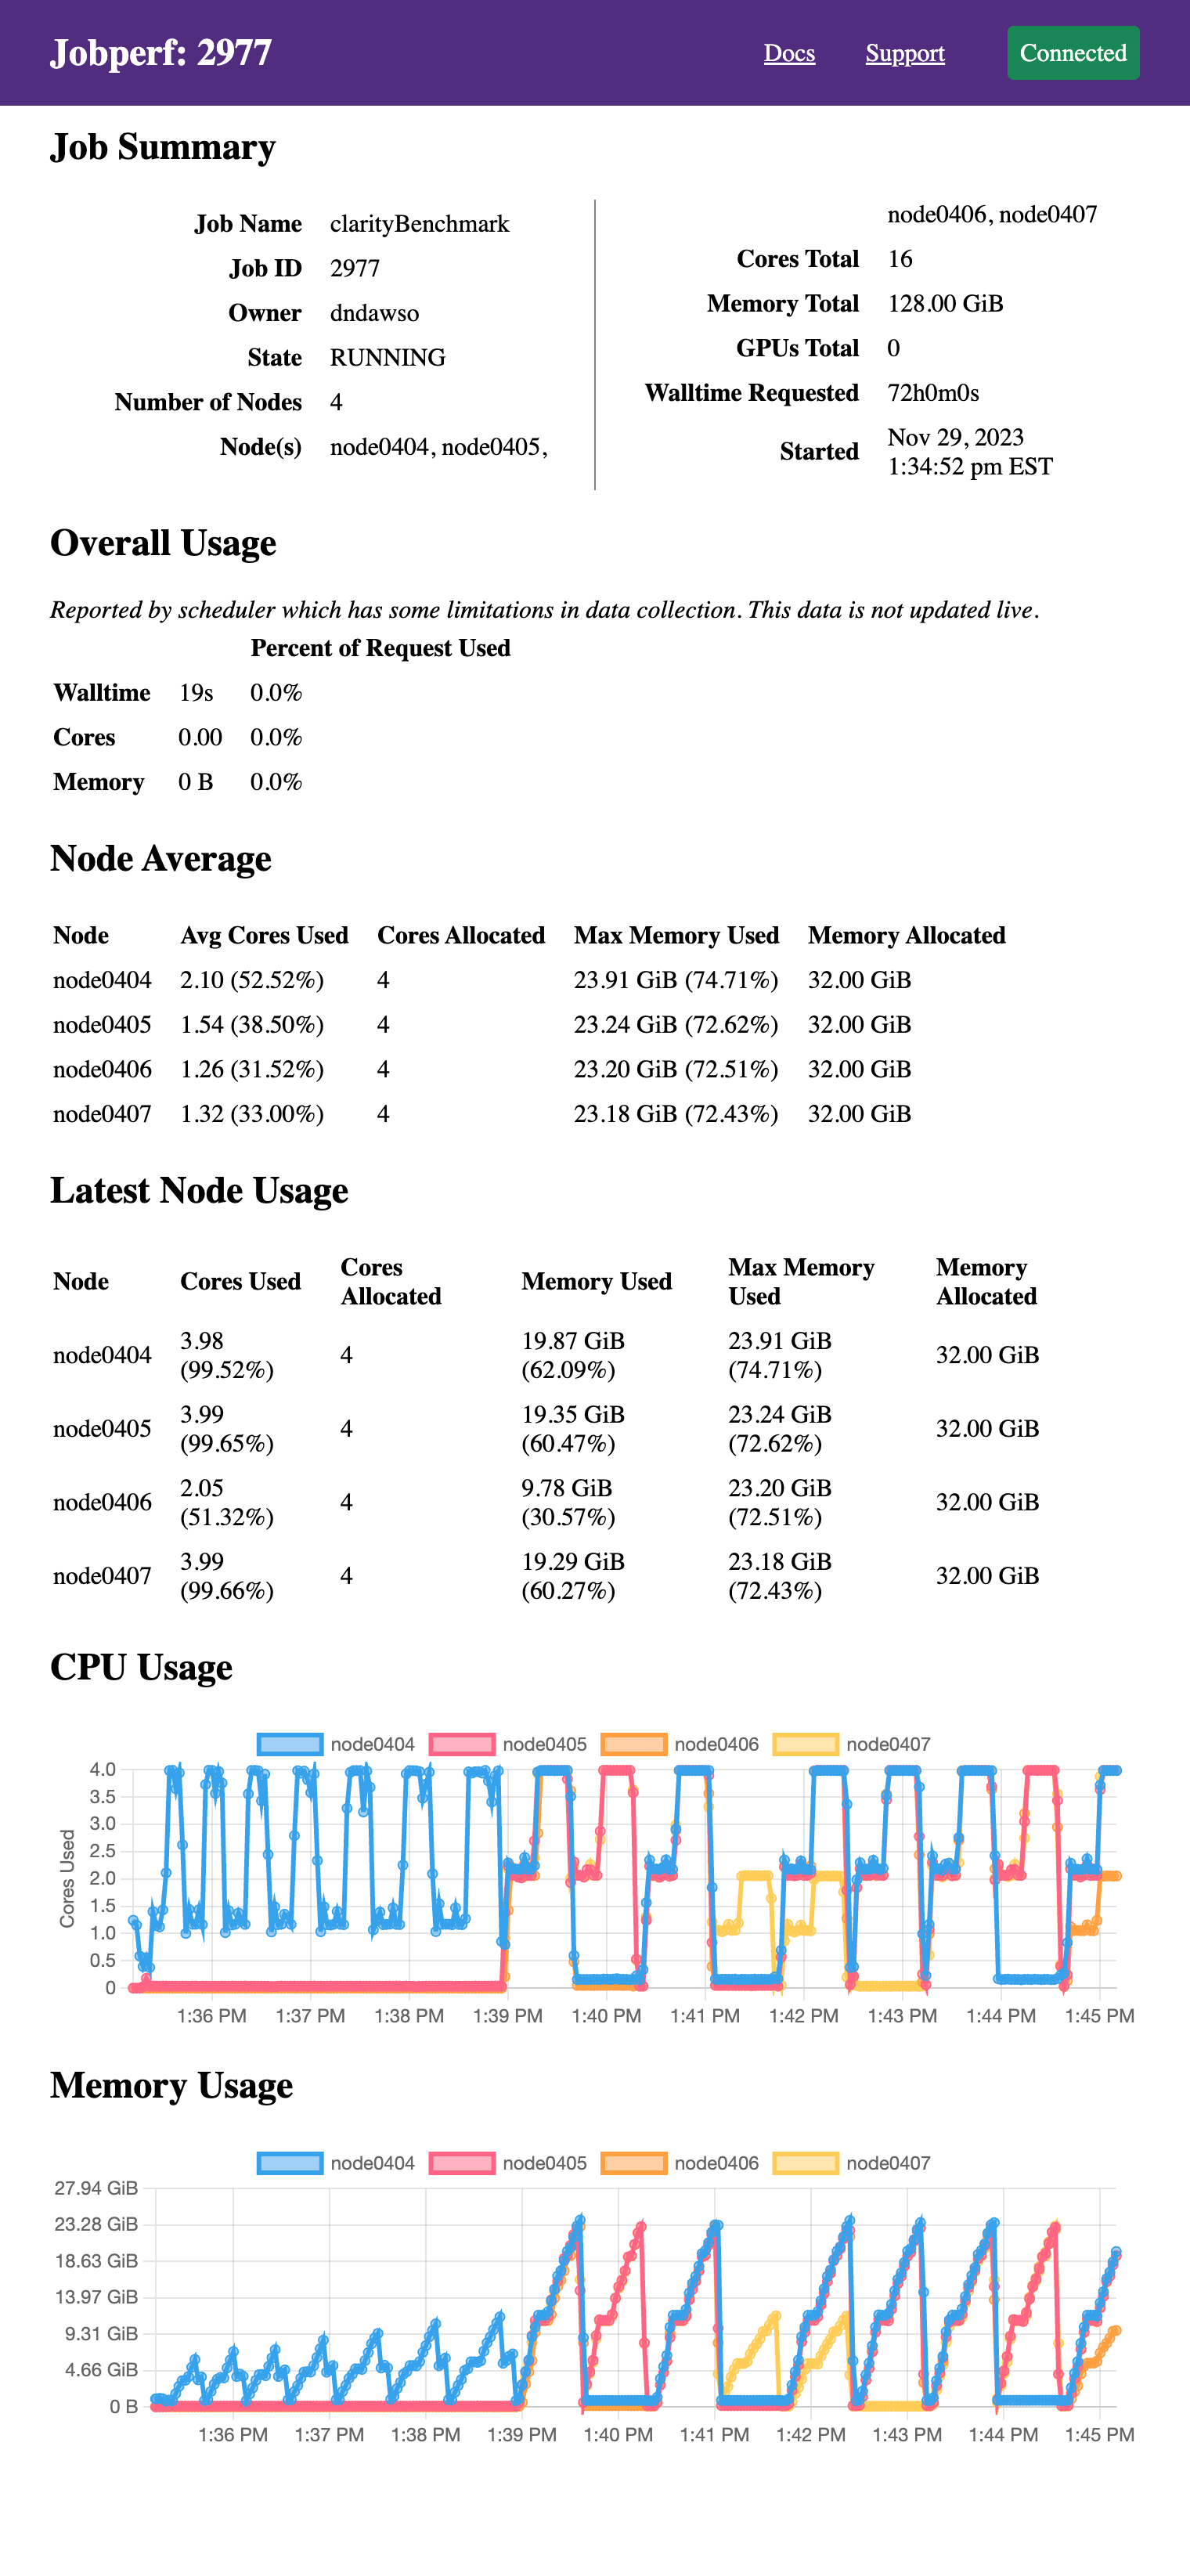
It displays the same information as would be printed to the terminal if run
without the -http option, just in web form. Since we passed the -w option,
it also continues to poll resource usage and dynamically plots the resource
usage. The screenshot above was taken after several minutes (initially, the
graphs are empty). This particular job did not request GPUs, but GPU usage will
also be displayed if they were requested in the job allocation.
These plots are particularly useful in checking for patterns on resource use. This particular program goes through two overall phases:
- meshing: uses up to 4 cores ~10GB of RAM on one node.
- solving: there are now periods where it uses all the cores on all 4 nodes and up to 23-24GB per node.
Ideally, if your job has different phases with different resource requirements, you'd split them across different nodes, but alas, this is a commercial software and there is no easy way to split these phases.
Embedding jobperf in Batch Script
Jobperf can also record and later recall resource utilization. This can be useful in monitoring batch jobs. To do this, we can add a line like this to your batch job script:
jobperf -record -w -rate 10s -http &
This will:
- [
-record] Record the data into a database (default DB location is~/.local/share/jobstats.db). - [
-w -rate 10s] Poll usage every 10 seconds (rather than collect just once). You can change the 10s to be what you would like. - [
-http] Start an web server so you can see stats while the job is running.
We use the & which will run jobperf in the background (otherwise it would
block and never run the rest of your script). You do not need to pass a job ID
since it is running within a job.
For example, you might have a batch script like this:
#!/bin/bash
#SBATCH --job-name jobperftest
#SBATCH --ntasks 1
#SBATCH --cpus-per-task 2
#SBATCH --mem 2gb
#SBATCH --time 0:10:00

jobperf -record -w -http -rate 10s &

module load anaconda3/2022.10

python do_work.py
Once the job is submitted, you can display the log file to see the jobperf URL to see live statistics (as described in the HTTP Usage above).
When the job is complete, you can see the recorded statistics by running the following from a login node:
jobperf -load -http <job-id>
This will display not only the summary statistics computed by the job scheduler, but it will also the graphs with usage for each node and GPU over time.
All jobperf Options
Use the -help option for the most up-to-date list of flags supported. These
are the current flags:
-w: Watch mode. Jobperf will not immediately return, instead it will keep polling at the rate set by the-rateflag. This only works for currently running jobs.-rate <time>: Sets the polling period in watch mode. E.g.1s,500ms,10s.-record: save samples (recorded in watch mode ---w) to a database indicated by-record-db.-record-db <filename>: file to use as SQLite DB. Defaults to~/.local/share/jobstats.db.-engine <enginename>: force the use of a particular job engine (eitherpbsorslurm). By default, jobperf will try to autodetect the scheduler.-http: start an HTTP server. See HTTP Usage.-http-port: start the HTTP server with a particular port. The default is to choose an arbitrary free port.-http-disable-auth: disable authentication on the HTTP server. The default allows only the job owner to connect.-debug: prints out debug logging. If you would like to report an error withjobperfwe'd love the output of running with-debug.