Using jobstats with Slurm
jobstats is a command-line tool that provides detailed statistics for jobs run
on the Slurm. It offers insights into various aspects of job performance,
including CPU and GPU utilization, memory usage, and overall efficiency. By
analyzing this data, users can optimize their resource requests, reduce queue
times, and improve the overall efficiency of their computational tasks.
jobstats Command Line Usage
To use jobstats, you need to execute the command followed by the job ID for
which you want to retrieve statistics. The basic syntax is:
jobstats <job_id>
For example, running the command:
jobstats 276073
will produce the following output:
================================================================================
                              Slurm Job Statistics
================================================================================
         Job ID: 276073
  NetID/Account: dndawso/cuuser_dndawso_joines_research
       Job Name: good
          State: COMPLETED
          Nodes: 1
      CPU Cores: 4
     CPU Memory: 8GB (2GB per CPU-core)
  QOS/Partition: normal/work1
        Cluster: palmetto2
     Start Time: Thu Jul 11, 2024 at 5:19 PM
       Run Time: 00:02:02
     Time Limit: 00:04:00

                              Overall Utilization
================================================================================
  CPU utilization  [||||||||||||||||||||||||||||||||||||||||||     85%]
  CPU memory usage [||||||||||||||||||||||||||||||||||||||||||||   89%]

                              Detailed Utilization
================================================================================
  CPU utilization per node (CPU time used/run time)
      node0495: 00:06:56/00:08:08 (efficiency=85.3%)

  CPU memory usage per node - used/allocated
      node0495: 7.1GB/8.0GB (1.8GB/2.0GB per core of 4)

                                     Notes
================================================================================
  * For additional job metrics including metrics plotted against time:
      https://ondemand.rcd.clemson.edu/pun/sys/jobstats  (VPN required off-campus)
we can infer several important details about the job's performance and resource utilization:
- CPU Utilization: The job is using 4 CPU cores on a single node with an overall CPU utilization efficiency of 85%. This indicates that the job is making very good use of the allocated CPU cores, with most of the CPU capacity being effectively utilized.
- Memory Usage: The job is using 7.1GB out of the allocated 8GB of memory, which translates to about 89% memory utilization. This suggests that the memory allocation is quite appropriate for the job, as the job is utilizing almost all the allocated memory.
- Job Duration: The job completed in 2 minutes and 2 seconds, which is slightly more than half of the requested time limit of 4 minutes. This indicates that the requested time was reasonable, but slightly more time was requested than needed. Adjusting the requested time to better match the actual run time can improve scheduling efficiency and reduce wait times in the job queue.
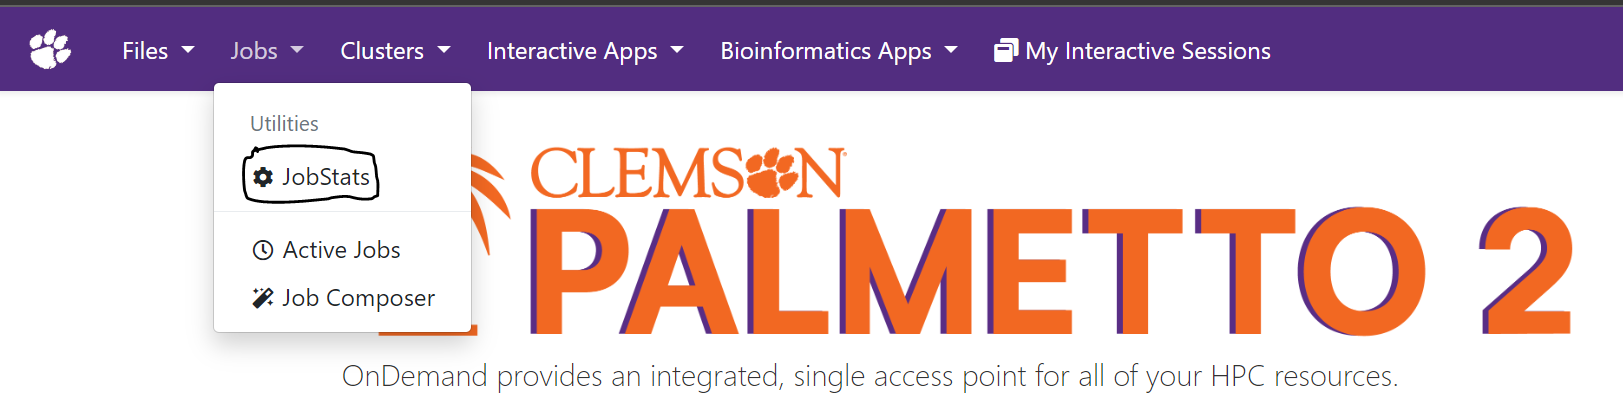
Using jobstats on Open OnDemand
When you log into palmetto2 Open OnDemand instance you will see, in the top left corner of your screen, a dropdown menu called "Jobs". In that dropdown you will see "Jobstats".
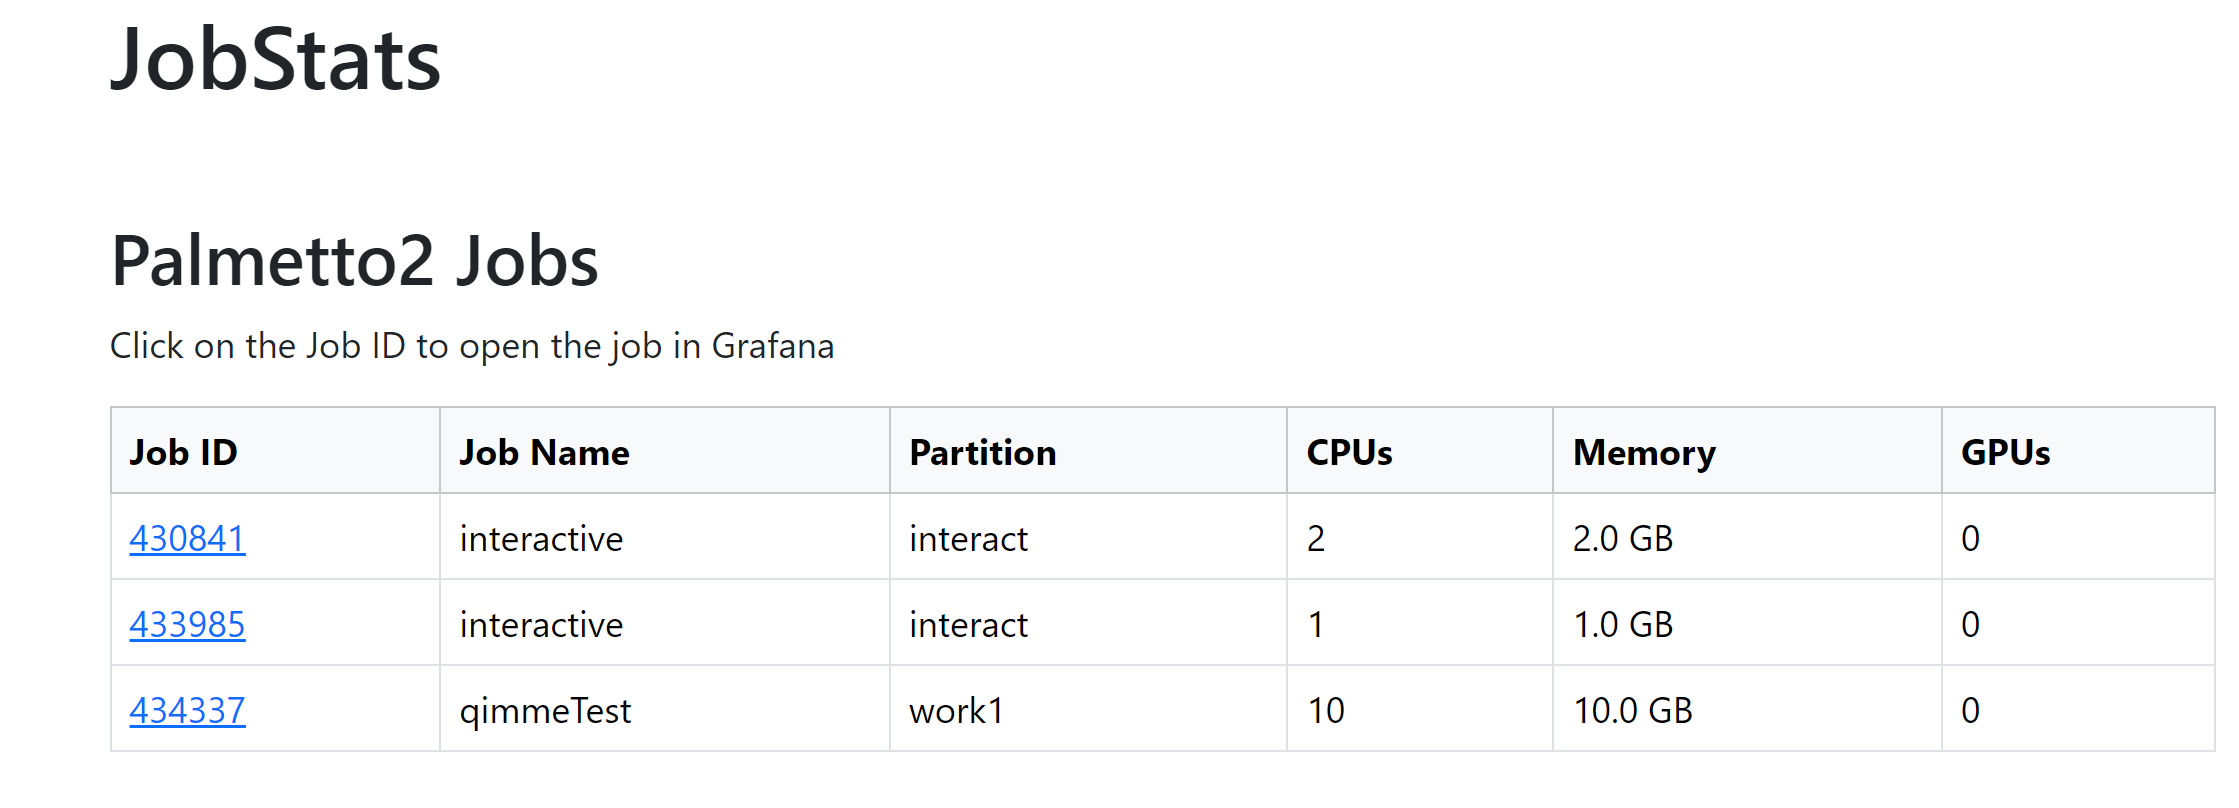
Once you select JobStats you will see a list of all jobs you have run in the past two weeks. To see the statistics of a job, select the JobID corresponding to that job.
It will then open a new window to a Grafana dashboard.
Note Grafana will only load when connected to Clemson's network or VPN.
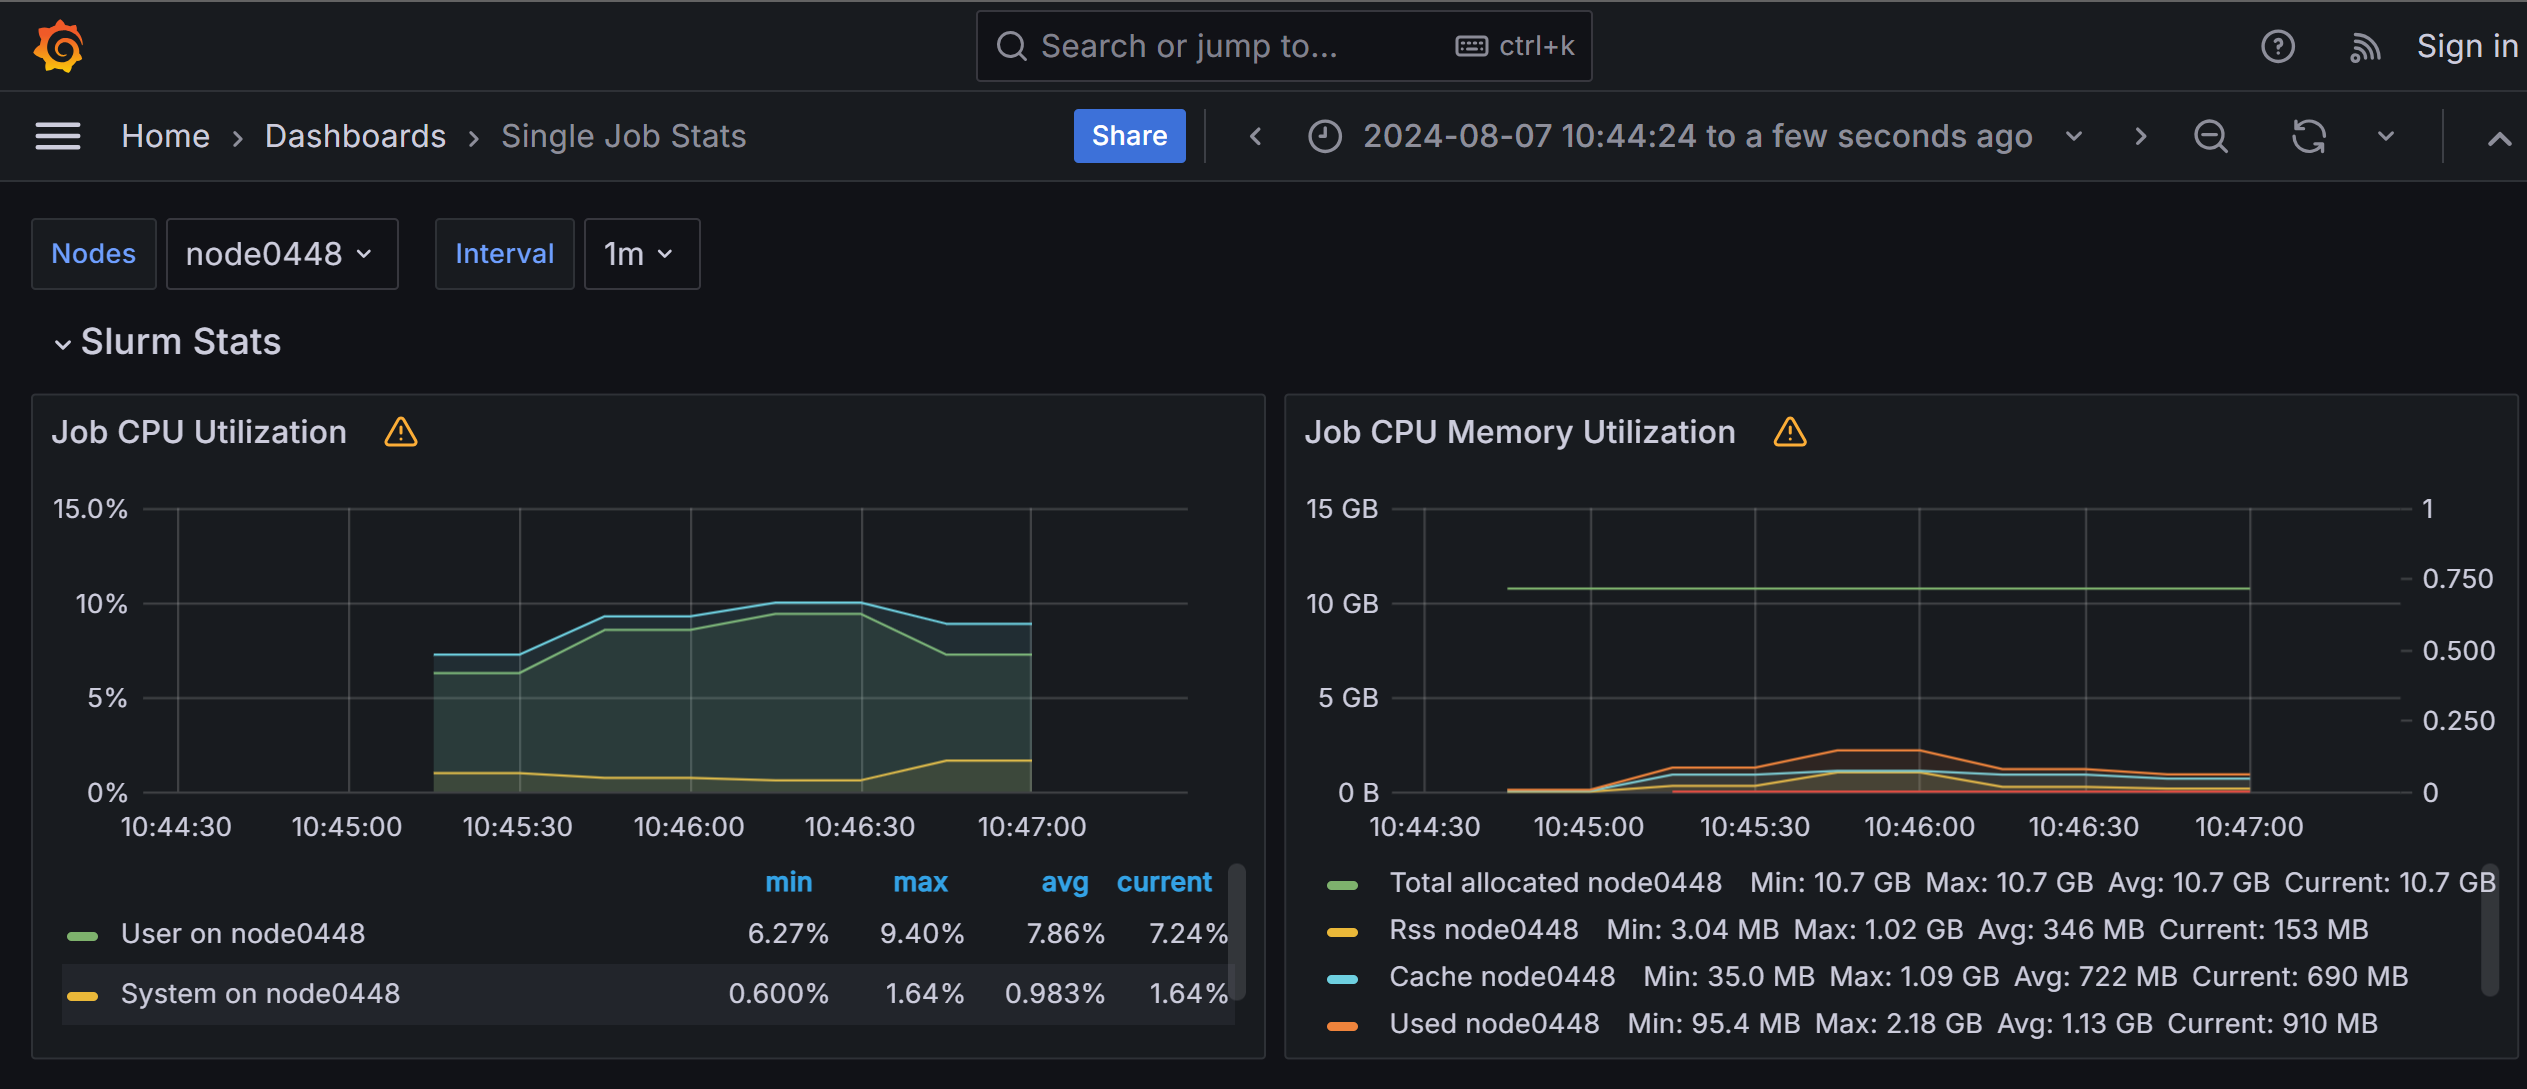
This dashboard provides information on CPU / GPU utilization, memory usage, and much more!