Job Metrics
Reviewing data about how your jobs perform can help you make better use of resources. On Palmetto, we provide access to metrics we collect via the XDMoD web interface.
XDMoD can only be accessed over the Clemson Network. If you are off-campus, connect to Clemson University VPN first.
What is XDMoD
XDMoD, short for XD Metrics on Demand, is a tool that allows users of HPC clusters to see their job history and metrics about performance. We use Open XDMoD on Palmetto, which is an open-source version funded by the National Science Foundation.
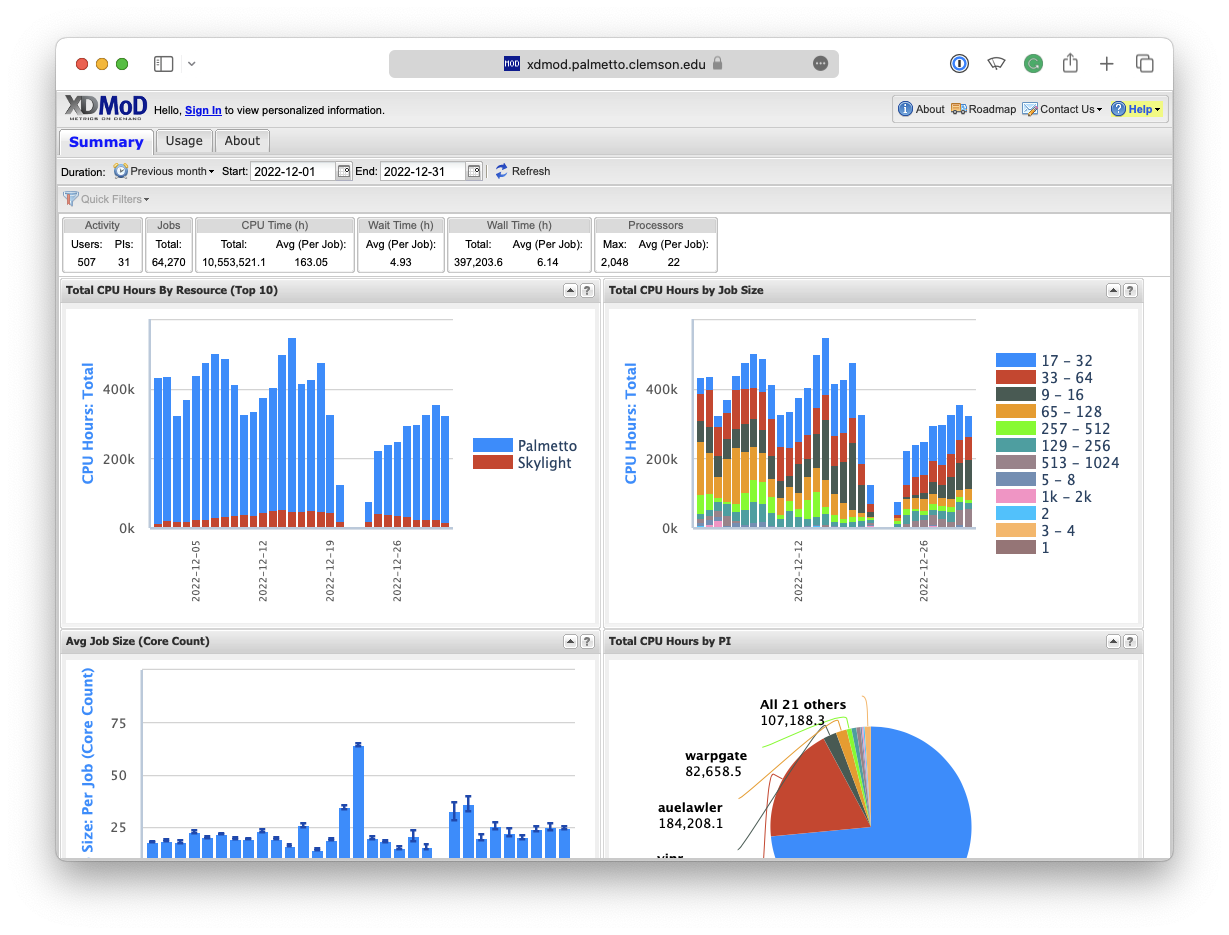
What Information Can I See in XDMoD?
The following metrics are collected for each job:
- Number of Jobs Submitted
- Number of Jobs Started
- Number of Jobs Running
- Number of Jobs Ended
- Queue Time
- Wall Time
- CPU Time
- GPU Time
- Job Size
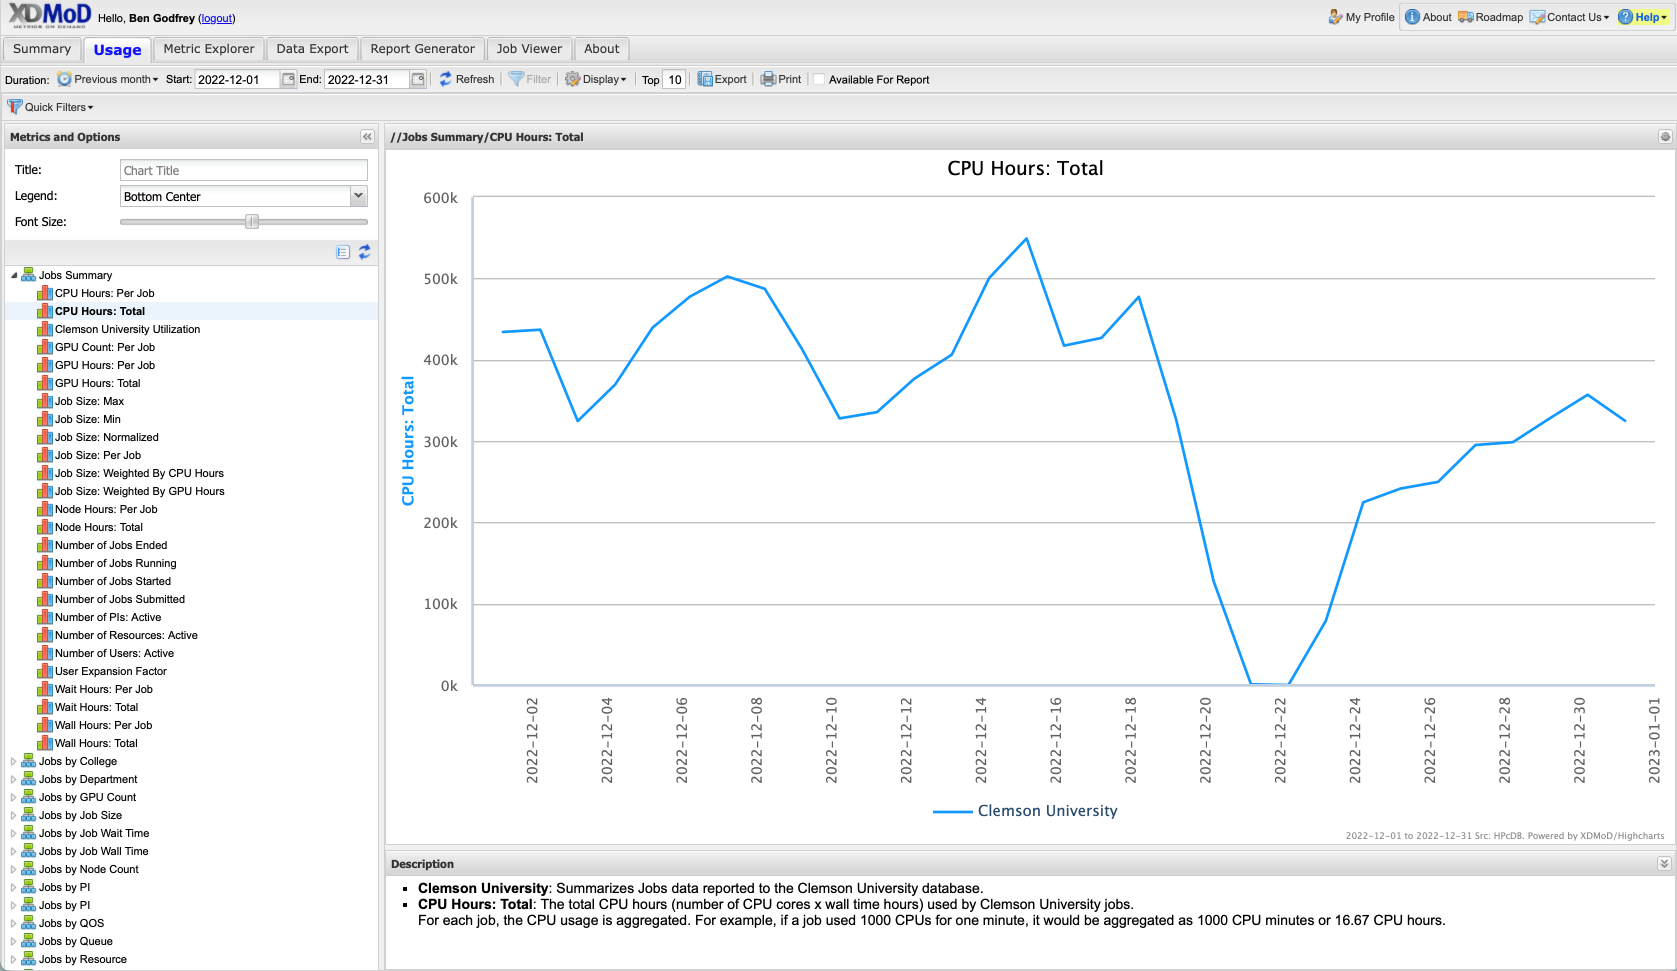
How Can I Analyze My Metrics?
Arguably the most useful feature of XDMoD is the Usage Explorer, which will allow you to see how your metrics change over time.
For personalized metrics, you must sign in to XDMoD.

Use the link at the top-left corner to sign in.
To get started with usage graphs, follow these instructions:
-
Select the Usage tab at the top of the screen.
-
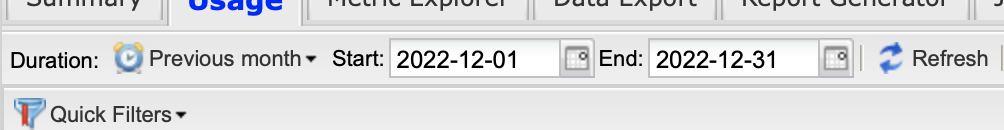
At the top of the screen, you can select the Duration which you would like to track. The default is the last month.
-
On the left side of the screen, there is a Metrics and Options list. Select a metric from the list that you are interested in.
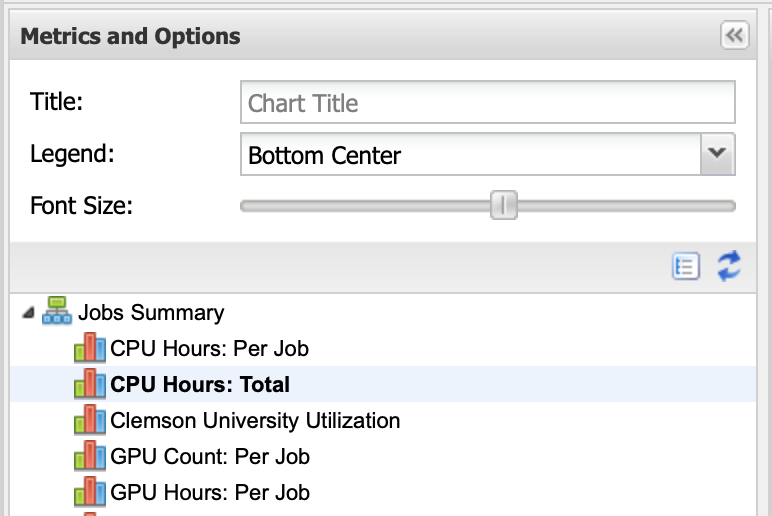
-
A graph will appear on the right side of the screen, presenting the value of your selected metric over time.