Job Monitoring in PBS
Monitoring your job is an important aspect of making sure you are requesting the right resources when you begin your job. It may be very hard to know how much to request when you first run a program, but if you monitor it, you can make more informed decisions in the future. Our acceptable use guidelines require that you do not request for more resources than your application can use - doing so would waste resources and prevent others using them.
Using jobperf with PBS
The jobperf command provides job statistics and live monitoring tools for both
Slurm and PBS. With it, you can see live performance metrics for each node and
GPU while a job is running.
jobperf Command Line Usage
The basic usage is to pass in the job ID (either PBS or Slurm):
jobperf 1214642.pbs02
This will print out summary information about the job as well as summary CPU and memory resource usage. If the job is running, it will also fetch current memory, CPU, and GPU usage for each node.
For example, here is the output for a job that has completed:
Job Summary
-----------
            Job Name:   cluster-openfoam-4x16-fdr
               Nodes:   4
     Total CPU Cores:   64
           Total Mem:   248gb
          Total GPUs:   0
  Walltime Requested:   12:00:00
              Status:   Finished

Overall Job Resource Usage
--------------------------
                                           Percent of Request
       Walltime Used   12:00:24            100.06 %
  Avg CPU Cores Used   61.42 cores         95.96 %
         Memory Used   27084840kb          10.42 %
At a glance, I can tell a few things about this job:
- 100% of walltime was used. This job didn't actually finish, it was likely killed by PBS. It is good to not request too much walltime, but it appears this job needed more time. If I run this again, I should bump up the walltime.
- I used 96% of requested CPU cores. This is excellent utilization. I won't have to change ncpus at all.
- I used only 10% of my memory requests (~27GB of 248GB). It is important to give yourself a safety buffer when requesting memory (PBS will kill jobs that reach their requested memory), but using only 10% of what was requested is wasteful. When running this job again, I should decrease the memory requests. If I use a safety margin of 50%, then that indicates my request should be for 27x1.5 = ~40GB total, or 10GB per node. Reducing this request would free up over 200GB for other users of the cluster!
When jobs are still running, the current CPU, memory, and GPU usage is displayed for each node. For example here are some results of running on a VASP job:
Job Summary
-----------
            Job Name:   vasp_gpu
               Nodes:   2
     Total CPU Cores:   4
           Total Mem:   40gb
          Total GPUs:   2
  Walltime Requested:   01:30:00
              Status:   Running

Overall Job Resource Usage
--------------------------
                                           Percent of Request
       Walltime Used   00:02:31            2.80 %
  Avg CPU Cores Used   1.03 cores          25.66 %
         Memory Used   12589808kb          30.02 %

Average Per Node Stats Over Whole Job
--------------------------
            CPU Cores                     Memory
Node        Requested   Used              Requested   Used
node0387    2           1.06 (53.12 %)    20.00 GB    6.01 GB (30.06 %)
node0284    2           1.06 (53.21 %)    20.00 GB    6.09 GB (30.47 %)

Fetching current usage...
Current Per Node Stats
--------------------------
            CPU Cores                     Memory
Node        Requested   Used              Requested   Used
node0387    2           1.01 (50.68 %)    20.00 GB    6.01 GB (30.06 %)
node0284    2           1.01 (50.69 %)    20.00 GB    6.09 GB (30.47 %)

Node        GPU Model                     Compute Usage  Memory Usage
node0387    NVIDIA A100 80GB PCIe         98.0 %         7404 MB
node0284    NVIDIA A100 80GB PCIe         98.0 %         8296 MB
From this we can tell a few things about the job:
- It is using one core on each node (2 were requested, so one core on each node is idle).
- It is making very good use of the GPUs, each GPU requested is near 100% utilization.
- It is using about 30% of memory requested. The may fluctuate over the course of the job so it may be better to wait until the job is complete before we decide we can reduce the memory requests.
You can also pass the -w option (jobperf -w <job id>). This will print all
the same information as without the -w, but it will keep requesting and
printing current per node CPU, memory, and GPU statistics.
jobperf HTTP Usage
If you'd rather look at the job stats in a web interface, you can do so with the
-http option. This is particularly useful with the -w (watch) option on jobs
that are still running:
jobperf -http -w 2977
It should print out a message like:
Started server on port 46543. View in Open OnDemand:
https://openod.palmetto.clemson.edu/rnode/node0401.palmetto.clemson.edu/46543/
If you visit this link in your browser, you should see a screen like the following (after logging in):
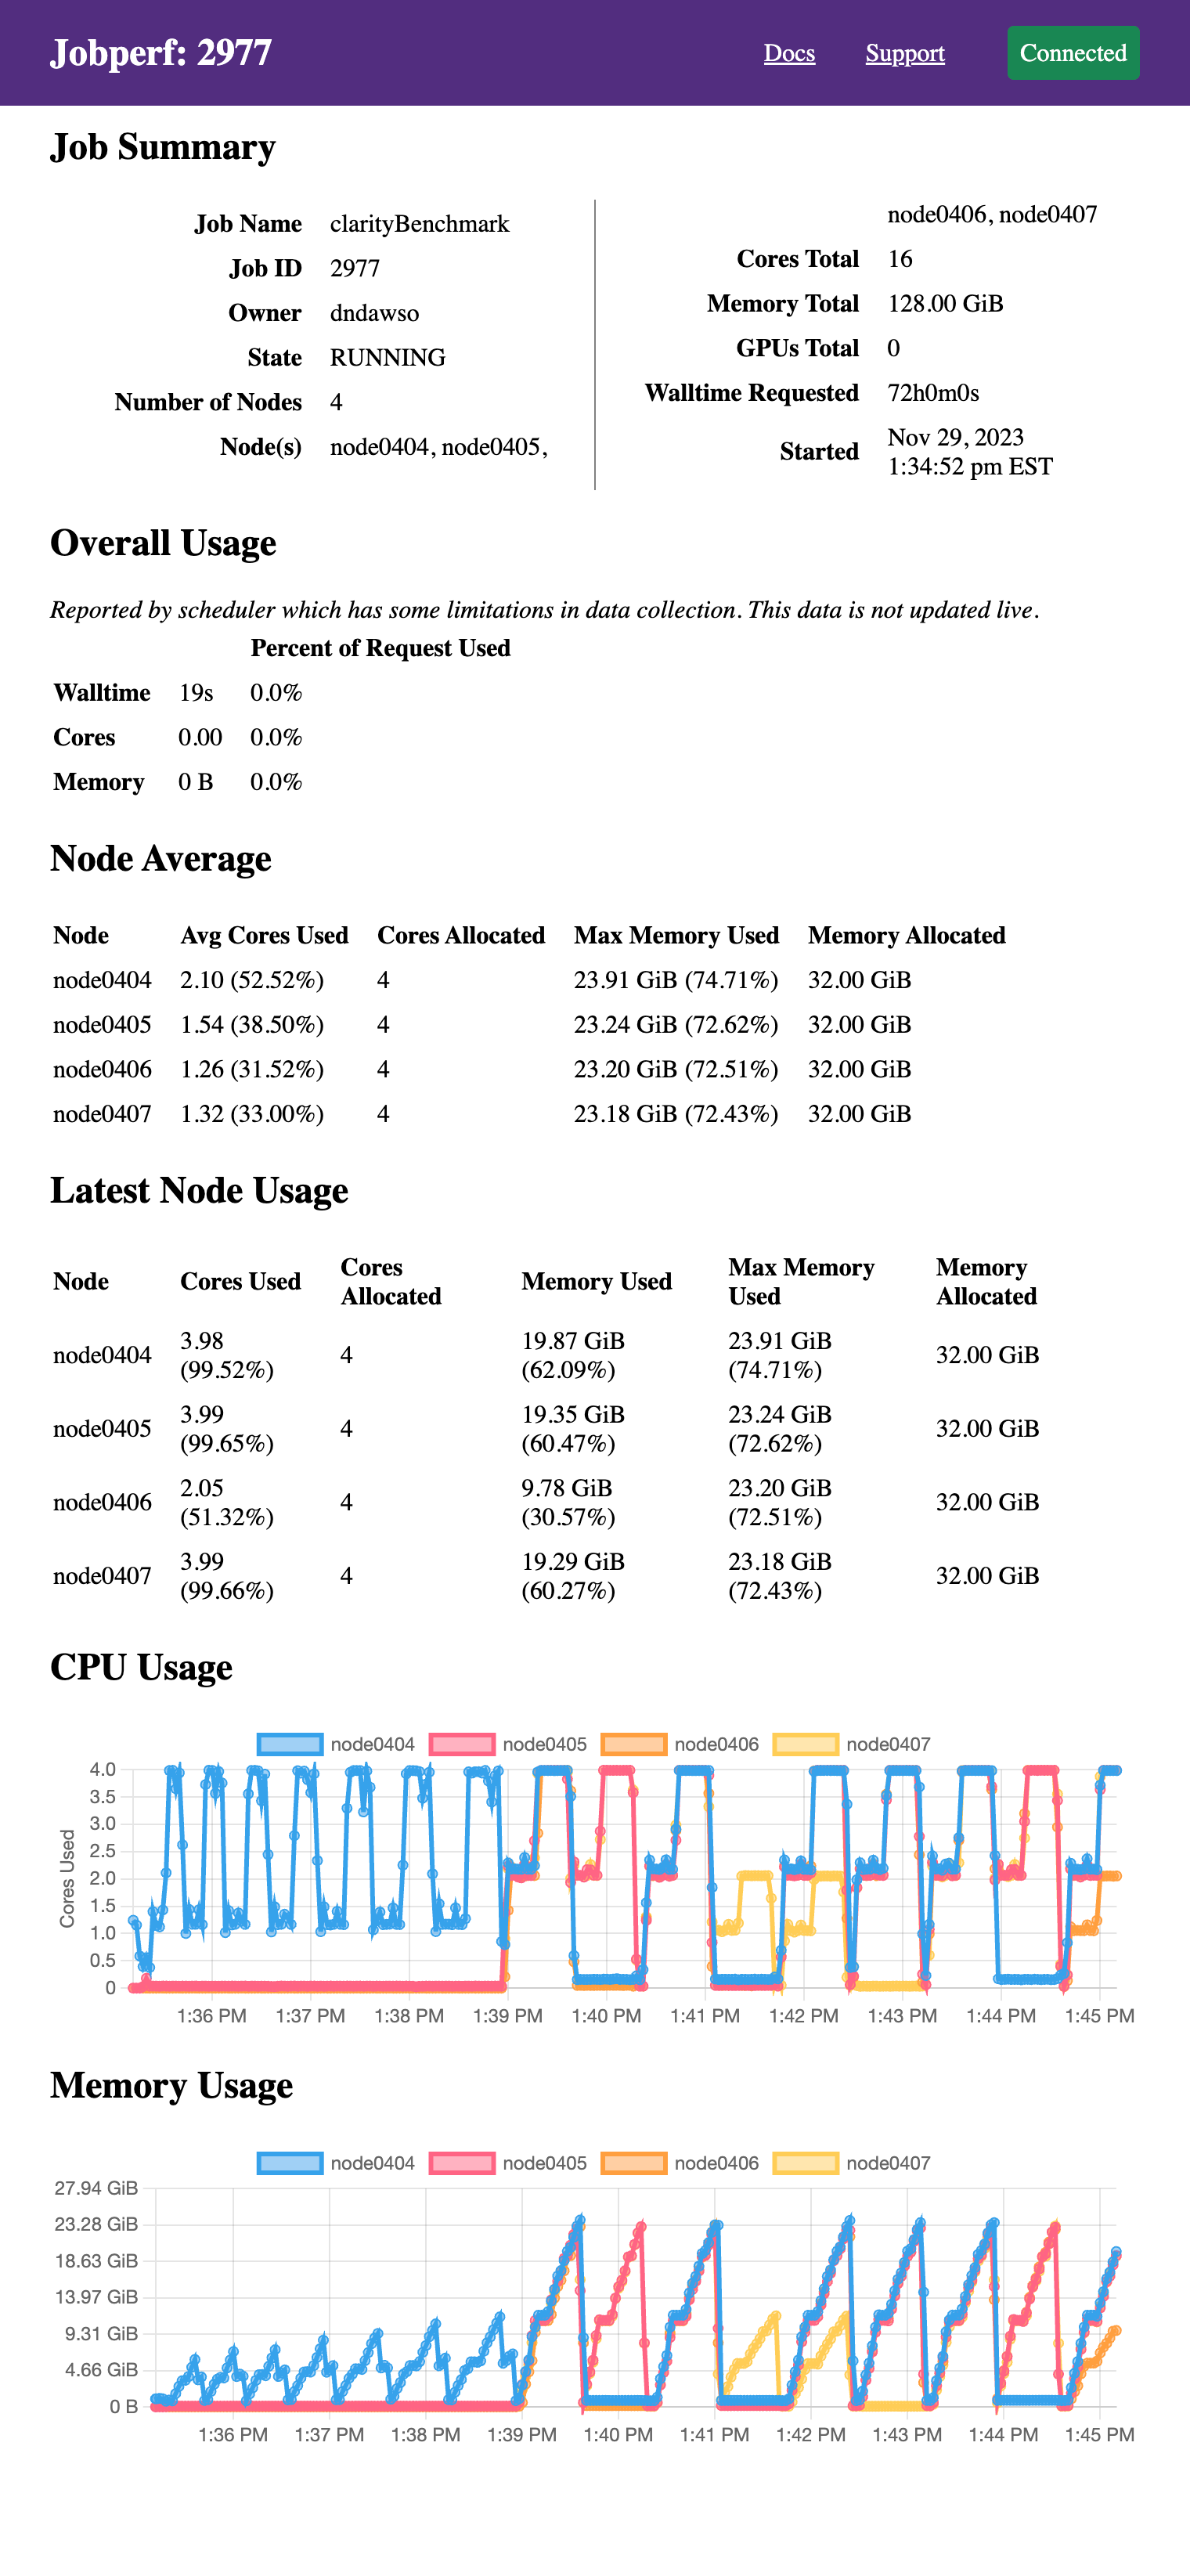
It displays the same information as would be printed to the terminal if run
without the -http option, just in web form. Since we passed the -w option,
it also continues to poll resource usage and dynamically plots the resource
usage. The screenshot above was taken after several minutes (initially, the
graphs are empty). This particular job did not request GPUs, but GPU usage will
also be displayed if they were requested in the job allocation.
These plots are particularly useful in checking for patterns on resource use. This particular program goes through two overall phases:
- meshing: uses up to 4 cores ~10GB of RAM on one node.
- solving: there are now periods where it uses all the cores on all 4 nodes and up to 23-24GB per node.
Ideally, if your job has different phases with different resource requirements, you'd split them across different nodes, but alas, this is a commercial software and there is no easy way to split these phases.
Embedding jobperf in Batch Script
Jobperf can also record and later recall resource utilization. This can be useful in monitoring batch jobs. To do this, we can add a line like this to your batch job script:
jobperf -record -w -rate 10s -http &
This will:
- [
-record] Record the data into a database (default DB location is~/.local/share/jobstats.db). - [
-w -rate 10s] Poll usage every 10 seconds (rather than collect just once). You can change the 10s to be what you would like. - [
-http] Start an web server so you can see stats while the job is running.
We use the & which will run jobperf in the background (otherwise it would
block and never run the rest of your script). You do not need to pass a job ID
since it is running within a job.
For example, you might have a batch script like this:
#!/bin/bash
#PBS -N jobperftest
#PBS -l select=1:ncpus=2:mem=2gb,walltime=0:10:00

jobperf -record -w -http -rate 10s &

cd $PBS_O_WORKDIR
module load anaconda3/2022.10-gcc/9.5.0

python do_work.py
Once the job is submitted, you can display the log file to see the jobperf URL to see live statistics (as described in the HTTP Usage above).
When the job is complete, you can see the recorded statistics by running the following from a login node:
jobperf -load -http <job-id>
This will display not only the summary statistics computed by the job scheduler, but it will also the graphs with usage for each node and GPU over time.
All jobperf Options
Use the -help option for the most up-to-date list of flags supported. These
are the current flags:
-w: Watch mode. Jobperf will not immediately return, instead it will keep polling at the rate set by the-rateflag. This only works for currently running jobs.-rate <time>: Sets the polling period in watch mode. E.g.1s,500ms,10s.-record: save samples (recorded in watch mode ---w) to a database indicated by-record-db.-record-db <filename>: file to use as SQLite DB. Defaults to~/.local/share/jobstats.db.-engine <enginename>: force the use of a particular job engine (eitherpbsorslurm). By default, jobperf will try to autodetect the scheduler.-http: start an HTTP server. See HTTP Usage.-http-port: start the HTTP server with a particular port. The default is to choose an arbitrary free port.-http-disable-auth: disable authentication on the HTTP server. The default allows only the job owner to connect.-debug: prints out debug logging. If you would like to report an error withjobperfwe'd love the output of running with-debug.
Using qstat with PBS
Introduction
You can verify CPU and memory usage for a job using
qstat. When you use the -f
flag, qstat prints the full list of status information, including resource
utilization information. We can get this information both for currently running
jobs as well as jobs that have recently (in the past couple days) completed.
As an example, let's walk though testing resource utilization of a job I
currently have running. To do this, I first need the job ID. To find the list of
jobs I have running, I can execute (replace dndawso with your username!):
qstat -u dndawso
I might see the following:
pbs02:
                                                            Req'd  Req'd   Elap
Job ID          Username Queue    Jobname    SessID NDS TSK Memory Time  S Time
--------------- -------- -------- ---------- ------ --- --- ------ ----- - -----
1214642.pbs02   dndawso  c2_fdr_* cluster-o* 17131*   4  64  248gb 12:00 R 04:14
I have one job: 1214642.pbs02 that is still running (S column is state and
R indicates running) and so far 4 hours and 14 minutes have passed (of a
maximum of 12 hours). If we want to take a look at the resources this job has
used, we can run:
qstat -f 1214642.pbs02
The complete output is very long. Here are just the resources_used and
Resource_List sections:
    resources_used.cpupercent = 1491
    resources_used.cput = 253:30:43
    resources_used.mem = 27084840kb
    resources_used.ncpus = 64
    resources_used.vmem = 15337816kb
    resources_used.walltime = 04:14:49
    Resource_List.mem = 248gb
    Resource_List.mpiprocs = 64
    Resource_List.ncpus = 64
    Resource_List.ngpus = 0
    Resource_List.nodect = 4
    Resource_List.place = scatter
    Resource_List.qcat = fdr_qcat
    Resource_List.select = 4:ncpus=16:mpiprocs=16:mem=62gb:interconnect=fdr:chi
        p_type=e5-2665
    Resource_List.walltime = 12:00:00
In my select statement, I had
select=4:ncpus=16:mpiprocs=16:mem=62gb:interconnect=fdr, so I had requested:
- 4 chunks or nodes (note:
Resource_List.nodect = 4) - 16 cores per chunk (note: so 16 x 4 = 64 cores total --
Resource_List.ncpus = 64) - 62 Gb of memory per chunk (note: so 62 x 4 = 248gb total --
Resource_List.mem = 248gb)
To see the resources I've actually used I should look at resources_used.cput
and resources_used.mem.
Memory Usage Analysis
For memory usage, we look at resources_used.mem. In this case we see
27084840kb. To convert kb (kilobytes) to gb (gigabytes) so we can compare to my
request, we'll follow the
units based on powers of 2
and divide by 1024 twice. So, 27084840kb = (27084840 / 1024 / 1024) gb =
25.83gb. This job used about 26 gigabytes total across all nodes, but I was
reserving about 64gb per node -- 248gb total! This is a large waste, and next
time I run this I should lower my requests significantly. I would add a 20% to
50% safety margin on the request since if my job ever surpasses the memory
request, the scheduler will kill the job. However, even with a 50% safety
margin, my memory requests should be more like 1.5 x (26gb / 4) per node which
is approximately 10gb per node. Running with 10gb per node would free up 208gb
for other jobs!
CPU Usage Analysis
Analyzing CPU usage is a bit trickier. For this we look at CPU time. CPU time records the time in which a CPU core was busy executing statements. It does not include any time the cores are idle. If there are multiple cores, each core contributes (if not idle).
As an example of CPU time, suppose we look at several programs that each run on 2 cores for 10 seconds.
- Program A uses core 1 completely for the whole 10 seconds. It is single threaded, so it doesn't make use of the second core. The total CPU time will be 10 seconds.
- Program B uses both cores completely for the whole 10 seconds. The total CPU time will be 20 seconds. Note, that this CPU time is longer than the elapsed time (wall time).
- Program C downloads a large file for the first 5 seconds and uses no CPU (reading and writing to hard drives and network can be slow and if the CPU has nothing else to do it will be idle), but then it runs analysis using both cores. So, for 5 (elapsed time) seconds zero cores are in use and for 5 (elapsed time) seconds two cores are in use. This leads to a total of 10 seconds of CPU time.
We can calculate the average number of cores in use by each of these programs by dividing the CPU Time by the elapsed time. So, for program A we have have 10s/10s = 1 core in use. For program B we have 20s/10s = 2 cores in use. For program C we see 10s/10s = 1 core in use (on average).
Just looking at CPU Time it is hard to tell between Program A and Program C
(whether the workload is just single threaded or bursty with lots of I/O).
Neither job is making effective use of the resources available, however the
ideal fix may be different for each. For program A, we should just request a
single core since the application is single threaded. For program C, perhaps the
downloading of large file should be moved to a separate pre-processing job with
minimal resource requests. It can be helpful to look at CPU usage over time to
help disambiguate these cases. You can do that with the -w option to
jobperf.
CPU Time is reported by qstat with resources_used.cput. For the example job
above (job ID 1214642.pbs02), we see CPU Time is 253:30:43 = 253 hours, 30
minutes, and 43 seconds. The elapsed time is given by resources_used.walltime
so 4 hours, 14 minutes, and 49 seconds. To find the effective cores, we can
divide resources_used.cput/resources_used.walltime. It'll be easier to do if
we convert the compound time units to just seconds:
resources_used.cput= 253:30:43 = 253x60x60 + 30x60 + 43 = 912643sresources_used.walltime= 04:14:49 = 4x60x60 + 14x60 + 49 = 15289s- Average CPU cores used = 912643s/15289s = 59.7 cores
In total this job requested 64 cores (across all nodes) and made average use of
59.7 cores. This is pretty good! We are 6.7% away from ideal. I would not adjust
the requested CPU resources for this job next time I run it. If I saw a
significant difference, I would lower my request (lower ncpus) next time I
submitted a job like this.
Completed Jobs
The example provided in the introduction section was for a running job, but we
can use the same analysis method for recently completed jobs. We just need to
pass the -x flag to qstat. For example, to get a list of all my jobs
(running and complete) I would use (replace dndawso with your username!):
qstat -x -u dndawso
To see the full qstat information about a completed job, I would run something
like:
qstat -x -f 1214642.pbs02