Online Material
Welcome to the online material for the Introduction to Research Computing on Palmetto (Slurm version).
Slides
The slides are available in Box.
What is Palmetto
Palmetto is a high-performance computing (HPC) cluster. The cluster is made up of over a thousand computers, called nodes, connected through networks called interconnects. It has various network mounted file systems, including home and parallel scratch storage systems. A scheduler coordinates the allocation of compute resources across the cluster.
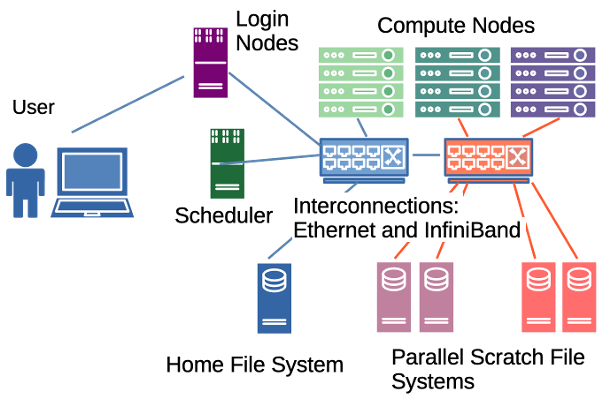
When you connect to Palmetto, you do not connect directly to the Scheduler nodes. Instead we connect to the Login nodes and from there have access to the file systems and scheduler.
Accessing Palmetto
Connect to Palmetto. Follow the steps laid out in the documentation to connect via SSH to Palmetto. On Windows, you will need to install MobaXterm.
Check the hostname. Run the following command:
hostname
What do you see?
Sample Output
You should see something like login001.palmetto.clemson.edu. You may be on a
different login node. We currently have 3 running (login001, login002,
login003). All of these possibilities indicate you are on a login node.
Resources
Each compute node has a series of resources that can be requested by jobs. There are two types:
- Consumable: only one job can use it at a time
- CPU Cores
- Memory
- GPUs
- Features: these resources are features of the node, one job requesting it
will not prevent others
- Interconnect type
- CPU Model
- GPU Model
Checking Available Resources
You can check the available compute resources on the Hardware Table page. This page provides information about all compute nodes in Palmetto, grouped by phases based on their installation timeline.
In addition to checking the Hardware Table page,
you can use the whatsfree command to get real-time information on available
resources.
whatsfree
The output from whatsfree is similar to the format of what you see in
Hardware Table page. You get the same one row per
phase information.
Storage
We have detailed documentation that covers much more that what we'll look at in this workshop.
Check to see what directory you are in. Run:
pwd
You should see /home/<username>.
If you see a different directory...
Go back home by running:
cd $HOME
Check the quota of your home. Run:
checkquota
Since most of you are new users of Palmetto, you should be using very little storage at the moment. Your max quota should read 250GB.
Check the contents of your home directory. Run:
ls
This may print nothing -- that is ok! You may not have any files in your home directory yet.
File Transfer
We offer many data transfer options, depending on the file you would like to transfer.
Let us test file transfer using SCP. First, download the following two files:
Next, upload them to palmetto.
-
On a Mac: open a (new) terminal, then run (make sure to replace your username):
cd ~/Downloadsscp compute_pi.R parallel_compute_pi.R username@hpcdtn01.rcd.clemson.edu:/home/usernameNoteThis terminal should be separate from the terminal used to run ssh. This command must be run from your local computer, it should not be run on the login node.
Complete documentation is available in our Palmetto documentation.
-
On Windows: use the built-in file browser on the left. Use the green arrow to upload the
compute_pi.Randparallel_compute_pi.Rfile you downloaded.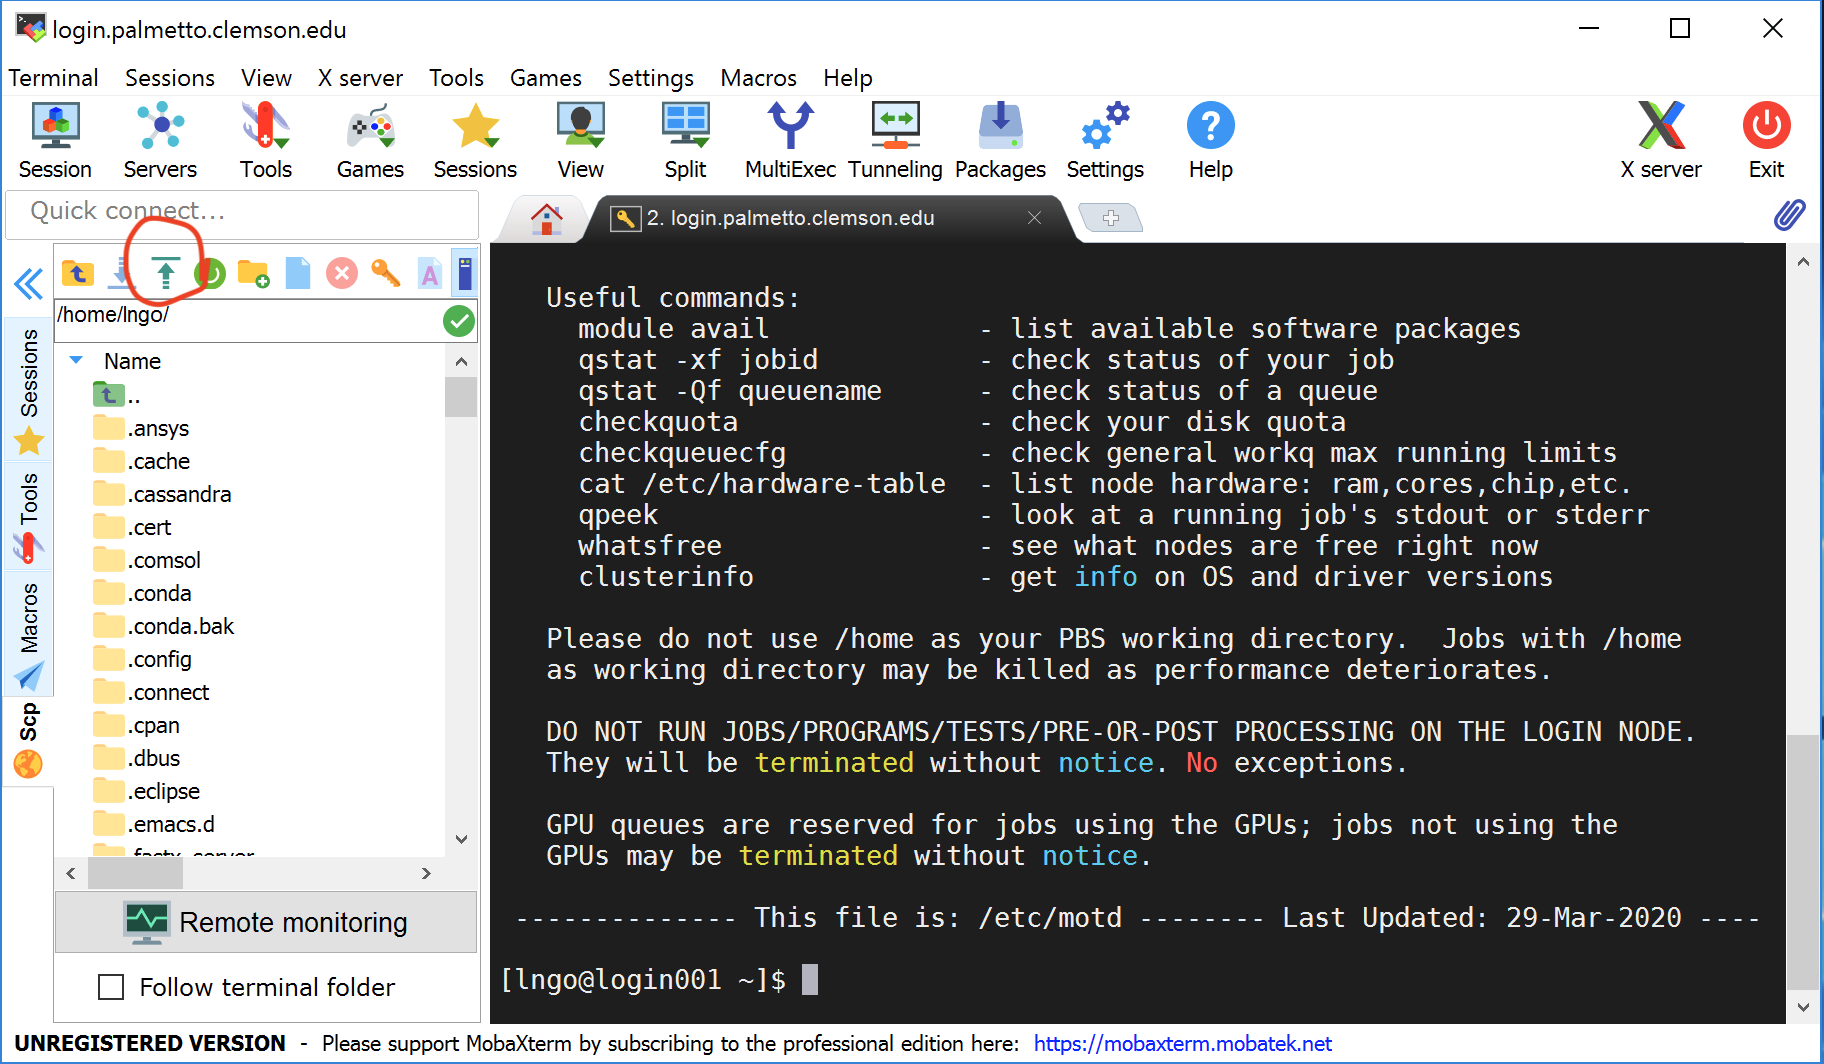
Complete documentation is available in our Palmetto documentation.
Finally, confirm the files are present by running
ls
in the terminal connected to the login node. You should now see compute_pi.R
and parallel_compute_pi.R.
Scheduling Jobs
To start an interactive job on Palmetto, we use salloc to request resources
from the scheduler.
Let's request one compute node. Please type the following (or paste from the website into your SSH terminal):
salloc --nodes=1 --ntasks-per-node=1 --cpus-per-task=1 --mem=1G --time=1:00:00
It is very important not to make typos, use spaces and upper/lowercases exactly as shown. If you make a mistake, nothing wrong will happen, but the scheduler won't understand your request.
Here are all the parts:
sallocmeans that we are asking the scheduler to grant us access to a compute node (note this is used for interactive jobs only);--nodes=1means we are asking for one compute node;--ntasks-per-node=1means we will conduct one task in this job;--cpus-per-task=1means that we only need 1 core for each task (one for this case) on the node (since all Palmetto compute nodes have at least 2 CPU cores, we might share the compute node with other users, but it's OK because users who use the same node do not interfere with each other);--mem=1Gmeans that we are asking for 1 Gb of RAM; again, memory is specific to the user, and not shared between different users who use the same node);- finally,
--time=1:00:00means that we are asking to use the node for 1 hour; after one hour we will be logged off the compute node if we haven't already disconnected.
This is not every resource specification possible. Be sure the check the Palmetto documentation for details on the resource limit specification.
When the job starts, you see some information from salloc, including the job
ID. For example:
salloc: Pending job allocation 2113
salloc: job 2113 queued and waiting for resources
salloc: job 2113 has been allocated resources
salloc: Granted job allocation 2113
salloc: Nodes node0405 are ready for job
This indicates the job ID is 2113. These job IDs are important to report if you ever need help with a job. They allow research facilitators quickly lookup information about the job.
Checkout the node name. It is available in your prompt, our you can run:
hostname
Look at details of the node your requested. Run:
scontrol show nodes <node-name>
This command shows us all the resources (by your own job and maybe by other user's jobs) being used on the node as well as all the hardware available (the total number of cores, gpus and memory). As a reminder: we only have access to what we request -- we don't have access to everything in the node.
Software on Palmetto
We have a lot of software installed on Palmetto, but most of it is organized into modules, which need to be loaded. To see which modules are available on Palmetto, please type
module avail
Hit SPACE several times to get to the end of the module list. This is a very
long list, and you can see that there is a lot of software installed for you. If
you want to see which versions of MATLAB are installed, you can type
module avail matlab
[dndawso@node0033 ~]$ module avail matlab

------------------------------------------------- /software/AltModFiles --------------------------------------------------
   matlab/MUSC2018b    matlab/2021a    matlab/2021b    matlab/2022a (D)

  Where:
   D:  Default Module

If the avail list is too long consider trying:

"module --default avail" or "ml -d av" to just list the default modules.
"module overview" or "ml ov" to display the number of modules for each name.

Use "module spider" to find all possible modules and extensions.
Use "module keyword key1 key2 ..." to search for all possible modules matching any of the "keys".
Let's use R. To load the module, you will need to specify its full name.To see which versions of R are available, type
module avail r
This will give you a list of all modules which have the letter "r" in them
(module avail is not very sophisticated). Let's see what happens when you load
the R 4.2.2 module:
module load  r/4.2.2
module list
Currently Loaded Modules:
  1) openjdk/11.0.17_8   2) r/4.2.2
R depends on other software to run, so we have configured the R module in a way that when you load it, it automatically loads other modules that it depends on.
Computing Pi
A simple way to compute Pi is to randomly pick points in a unit for the unit square using a uniform distribution. We then detect if a point is within the quarter of the unit circle in that exists in the quadrant. To compute an estimate for Pi, we can divide the number of points inside the circle by the total number of points (which gives us an estimate for the area inside this quarter circle) and multiply by 4.
The two scripts we uploaded in the File Transfer section perform this estimate. Let's run the first one. Since the R module should be loaded, we can run:
Rscript compute_pi.R
We should see the following message:
Killed
What's happened here is that our application requested too much memory. When you exceed the memory you requested (1gb here), Slurm will kill your job.
If your job was not killed, end it by typing exit. Make sure you are back on
the login node. Let's start a new interactive job with 4gb of memory:
salloc --nodes=1 --ntasks-per-node=1 --cpus-per-task=1 --mem=4G --time=1:00:00
Now, let's run the compute script:
Rscript compute_pi.R
We get the following output:
bash: Rscript: command not found
This is expected. Every time you start a new job, you get a new clean environment. Load R, then start the script. Note, we run the script now with the time command so we can see how long it takes.
module load  r/4.2.2
time Rscript compute_pi.R
The script will take about 15-25 seconds to finish:
Estimated Pi: 3.141499

real	0m14.763s
user	0m13.917s
sys   0m0.310s
This is pretty slow. Let's see if we can speed this up.
Speeding Things Up?
Palmetto's power does not come from exceptionally fast processors. In particular, the 1g nodes are quite old and the "single core performance" is pretty low.
The real power of Palmetto comes from the ability to span across many cores (and even multiple nodes).
Let's exit out of our previous 1 core job (run exit to leave an interactive
job) and start an 8 core job:
salloc --nodes=1 --ntasks-per-node=1 --cpus-per-task=8 --mem=4G --time=1:00:00
Let's time that script again:
module load  r/4.2.2
time Rscript compute_pi.R
There should be no speed up. The reason is that R only runs a single thread (by default). A thread can only run on one core at a time so adding more threads does nothing.
Monitoring Jobs
A handy way to monitor a job's resource utilization is
jobperf. This tool runs on the login node
and we pass the job ID as an argument.
First get another SSH session so that you still have your job running, but also have a connection to the login node.
Once you have ssh session connected to the login node, run:
squeue --me
This shows you all your currently running jobs. The command squeue
has many useful options
that allow you to inspect your jobs (both running and complete).
For example, I see the following
  JOBID PARTITION     NAME     USER ST       TIME  NODES NODELIST(REASON)
   2121     work1 interact  fanchem  R      13:11      1 node0404
I see that my job has job ID 2121. We can now monitor it's status with
jobperf. We want to continually monitor the job while we run, so we'll pass
the -w option. This will cause jobperf to periodically poll the job's nodes
to see resource usage. I would run the following:
jobperf -w 2121
While the jobperf command is running on the login node, I run the following on
the compute node:
time Rscript compute_pi.R
I can see that it is using just 1 core as we theorized:
            CPU Cores                     Memory
Node        Requested   Usage             Requested   Current Use    Max Used
node0033    8           0.99 (12.43 %)    4.00 GiB    2.07 GiB       2.08 GiB (51.91 %)
To speed this up, we can use the parallel package for R. This package spins up
a series of threads and allows you to do spawn independent tasks on each thread.
This problem is well suited for parallelism since each point can be generated
and analyzed independently. The parallel_compute_pi.R script implements this.
It takes a command line argument for how many threads we should spin up. Let's
start with 4:
time Rscript parallel_compute_pi.R 4
Output:
[fanchem@node0404 ~]$ time Rscript parallel_compute_pi.R 4
Using  4  cores with  1250000  point per core ( 5e+06  points total)
Estimated Pi: 3.141338

real	0m4.273s
user	0m0.112s
sys	  0m0.048s
And in our jobperf window we see it was using about 4 cores now:
            CPU Cores                     Memory
Node        Requested   Usage             Requested   Current Use    Max Used
node0033    8           3.96 (49.48 %)    4.00 GiB    512.98 MiB     2.08 GiB (51.91 %)
If we run at 8 threads:
time Rscript parallel_compute_pi.R 8
Output:
[fanchem@node0404 ~]$ time Rscript parallel_compute_pi.R 8
Using  8  cores with  625000  point per core ( 5e+06  points total)
Estimated Pi: 3.142934

real	0m2.454s
user	0m0.119s
sys	  0m0.047s
And in our jobperf window we see it was using about 8 cores now:
            CPU Cores                     Memory
Node        Requested   Usage             Requested   Current Use    Max Used
node0033    8           7.86 (98.27 %)    4.00 GiB    952.65 MiB     2.08 GiB (51.91 %)
Although R has some very nice packages that enable you to split your work across multiple threads to take advantage of multiple cores, it does require code change -- it does not happen magically. If you are curious, you can take a look at the code changes needed to convert compute_pi.R to parallel_compute_pi.R by running:
git diff compute_pi.R parallel_compute_pi.R --ignore-space-change
This workload was fairly easy to parallelize. Each thread could independently generate random points and test them. Other workloads will have to be parallelized differently and some may not parallelize at all. Feel free to discuss your problem with us in office hours.
This is a pretty significant speed up. Lets go even higher, let's use 24 cores!
[fanchem@node0404 ~]$]$ time Rscript parallel_compute_pi.R 24
Using  24  cores with  208333  point per core ( 4999992  points total)
Estimated Pi: 3.140563

real	0m2.873s
user	0m0.121s
sys	  0m0.059s
Remember we still only have access to 8 cores. Once we use more threads than cores, the threads will start to compete causing your code to get slower.
What happens if we were to request more than one chunk (more than one node)?
To test this, let's run 2 nodes, 4 cores each:
salloc --nodes=2 --ntasks-per-node=4 --cpus-per-task=1 --mem=1G --time=1:00:00
Then, we start and run the parallel version with 8 cores (since we have 8 cores total):
[fanchem@node0404 ~]$ module load r/4.2.2
[fanchem@node0404 ~]$ time Rscript parallel_compute_pi.R  8
Using  8  cores with  625000  point per core ( 5e+06  points total)
Estimated Pi: 3.142035

real	0m3.164s
user	0m0.120s
sys	0m0.051s
jobperf output:
            CPU Cores                     Memory
Node        Requested   Usage             Requested   Current Use    Max Used
node0300    4           3.95 (98.86 %)    4.00 GiB    953.36 MiB     953.36 MiB (23.28 %)
node0033    4           0.00 (0.00 %)     4.00 GiB    0 B            0 B (0.00 %)
Even though we are using the parallel package, it doesn't (by default) magically span threads across nodes. For that we typically use something like MPI, Spark, or Dask.
Notice these tests were done on HDR nodes.
What happens if we were to request 1g nodes?
Compared to HDR node, 1g nodes are our oldest nodes and have worse performance per core. We should see a speed drop by requesting them.
There are some reasons to consider not using HDR nodes, however.
- These nodes tend to be in higher demand, increasing the chance you will wait in a queue.
- Some of these nodes are owned by faculty members and their priority jobs may preempt your job.
- Since they are in higher demand, we monitor them more for violations of our acceptable use guidelines. Do not request a large amount of HDR resources and let them sit idle.
Can we improve the code?
Those of you who are proficient in R may have noticed our implementation was quite inefficient. The current code samples each point and tests each point independently. R is not particularly efficient with this. It is much faster to let R operate on vectors and matrices. We can vectorize our code in parallel_compute_pi.R by changing this loop:
    inside_circle <- 0
    for (i in 1:(num_points / num_cores)) {
        x <- runif(1, 0, 1) # Generate random x-coordinate
        y <- runif(1, 0, 1) # Generate random y-coordinate

        # Check if the point is inside the quarter-circle
        if (x^2 + y^2 <= 1) {
            inside_circle <- inside_circle + 1
        }
    }
    return(inside_circle)
Into this vectorized code:
    num_points_thread <- num_points / num_cores
    x <- runif(num_points_thread, 0, 1)
    y <- runif(num_points_thread, 0, 1)
    return(sum(x^2 + y^2 <= 1))
Now when we run this code again with 4 cores on 1g nodes, we see a massive improvement:
[fanchem@node0404 ~]$ time Rscript parallel_compute_pi2.R  4
Using  4  cores with  1250000  point per core ( 5e+06  points total)
Estimated Pi: 3.141072

real	0m0.490s
user	0m0.124s
sys	  0m0.042s
Oftentimes, it is our own code that contains inefficiencies, and the more you learn about your language of choice, the better you can write efficient code.
Open OnDemand
We have an interface to Palmetto that works through a Web browser. This interface is called "Open On Demand", or OpenOD for short. To access it, go to
https://ondemand.rcd.clemson.edu
You will need to login with your Clemson username and password, and perform a DUO check.
File Browsing
One convenient feature of Open OnDemand is a file browser. In the top left corner, you will see the "Files" button, which will take you to your home directory or to scratch directory. Click it and explore the files in your file system. You can use this feature to view, edit, and delete files. It is also a convenient way to upload and download the files. You can go to any folder that you have access to by clicking "Go to".
Shell
You can also use the web interface to run a terminal on Palmetto. This way,
OpenOD becomes an alternative to MobaXTerm or to the Mac Terminal application.
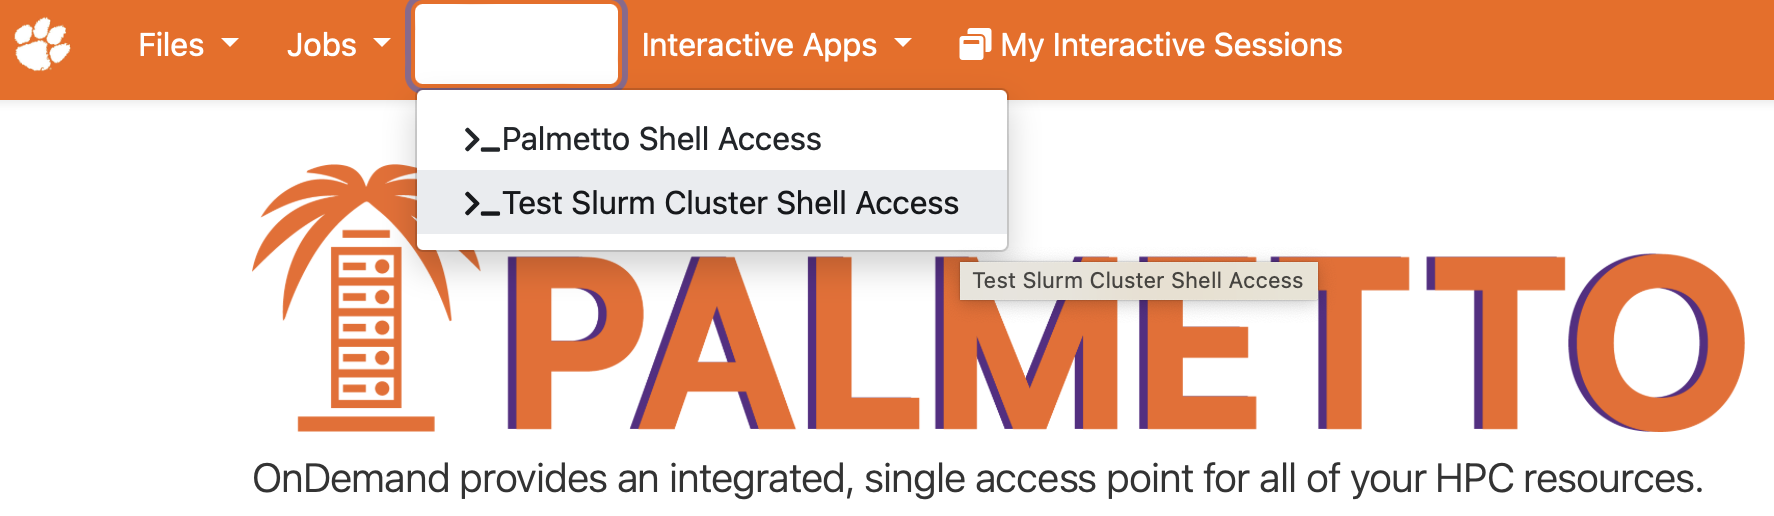
To start the terminal, click on Clusters, then Palmetto Shell Access:
Enter your account password and do the two-factor identification. This will bring you to the login node of Palmetto:
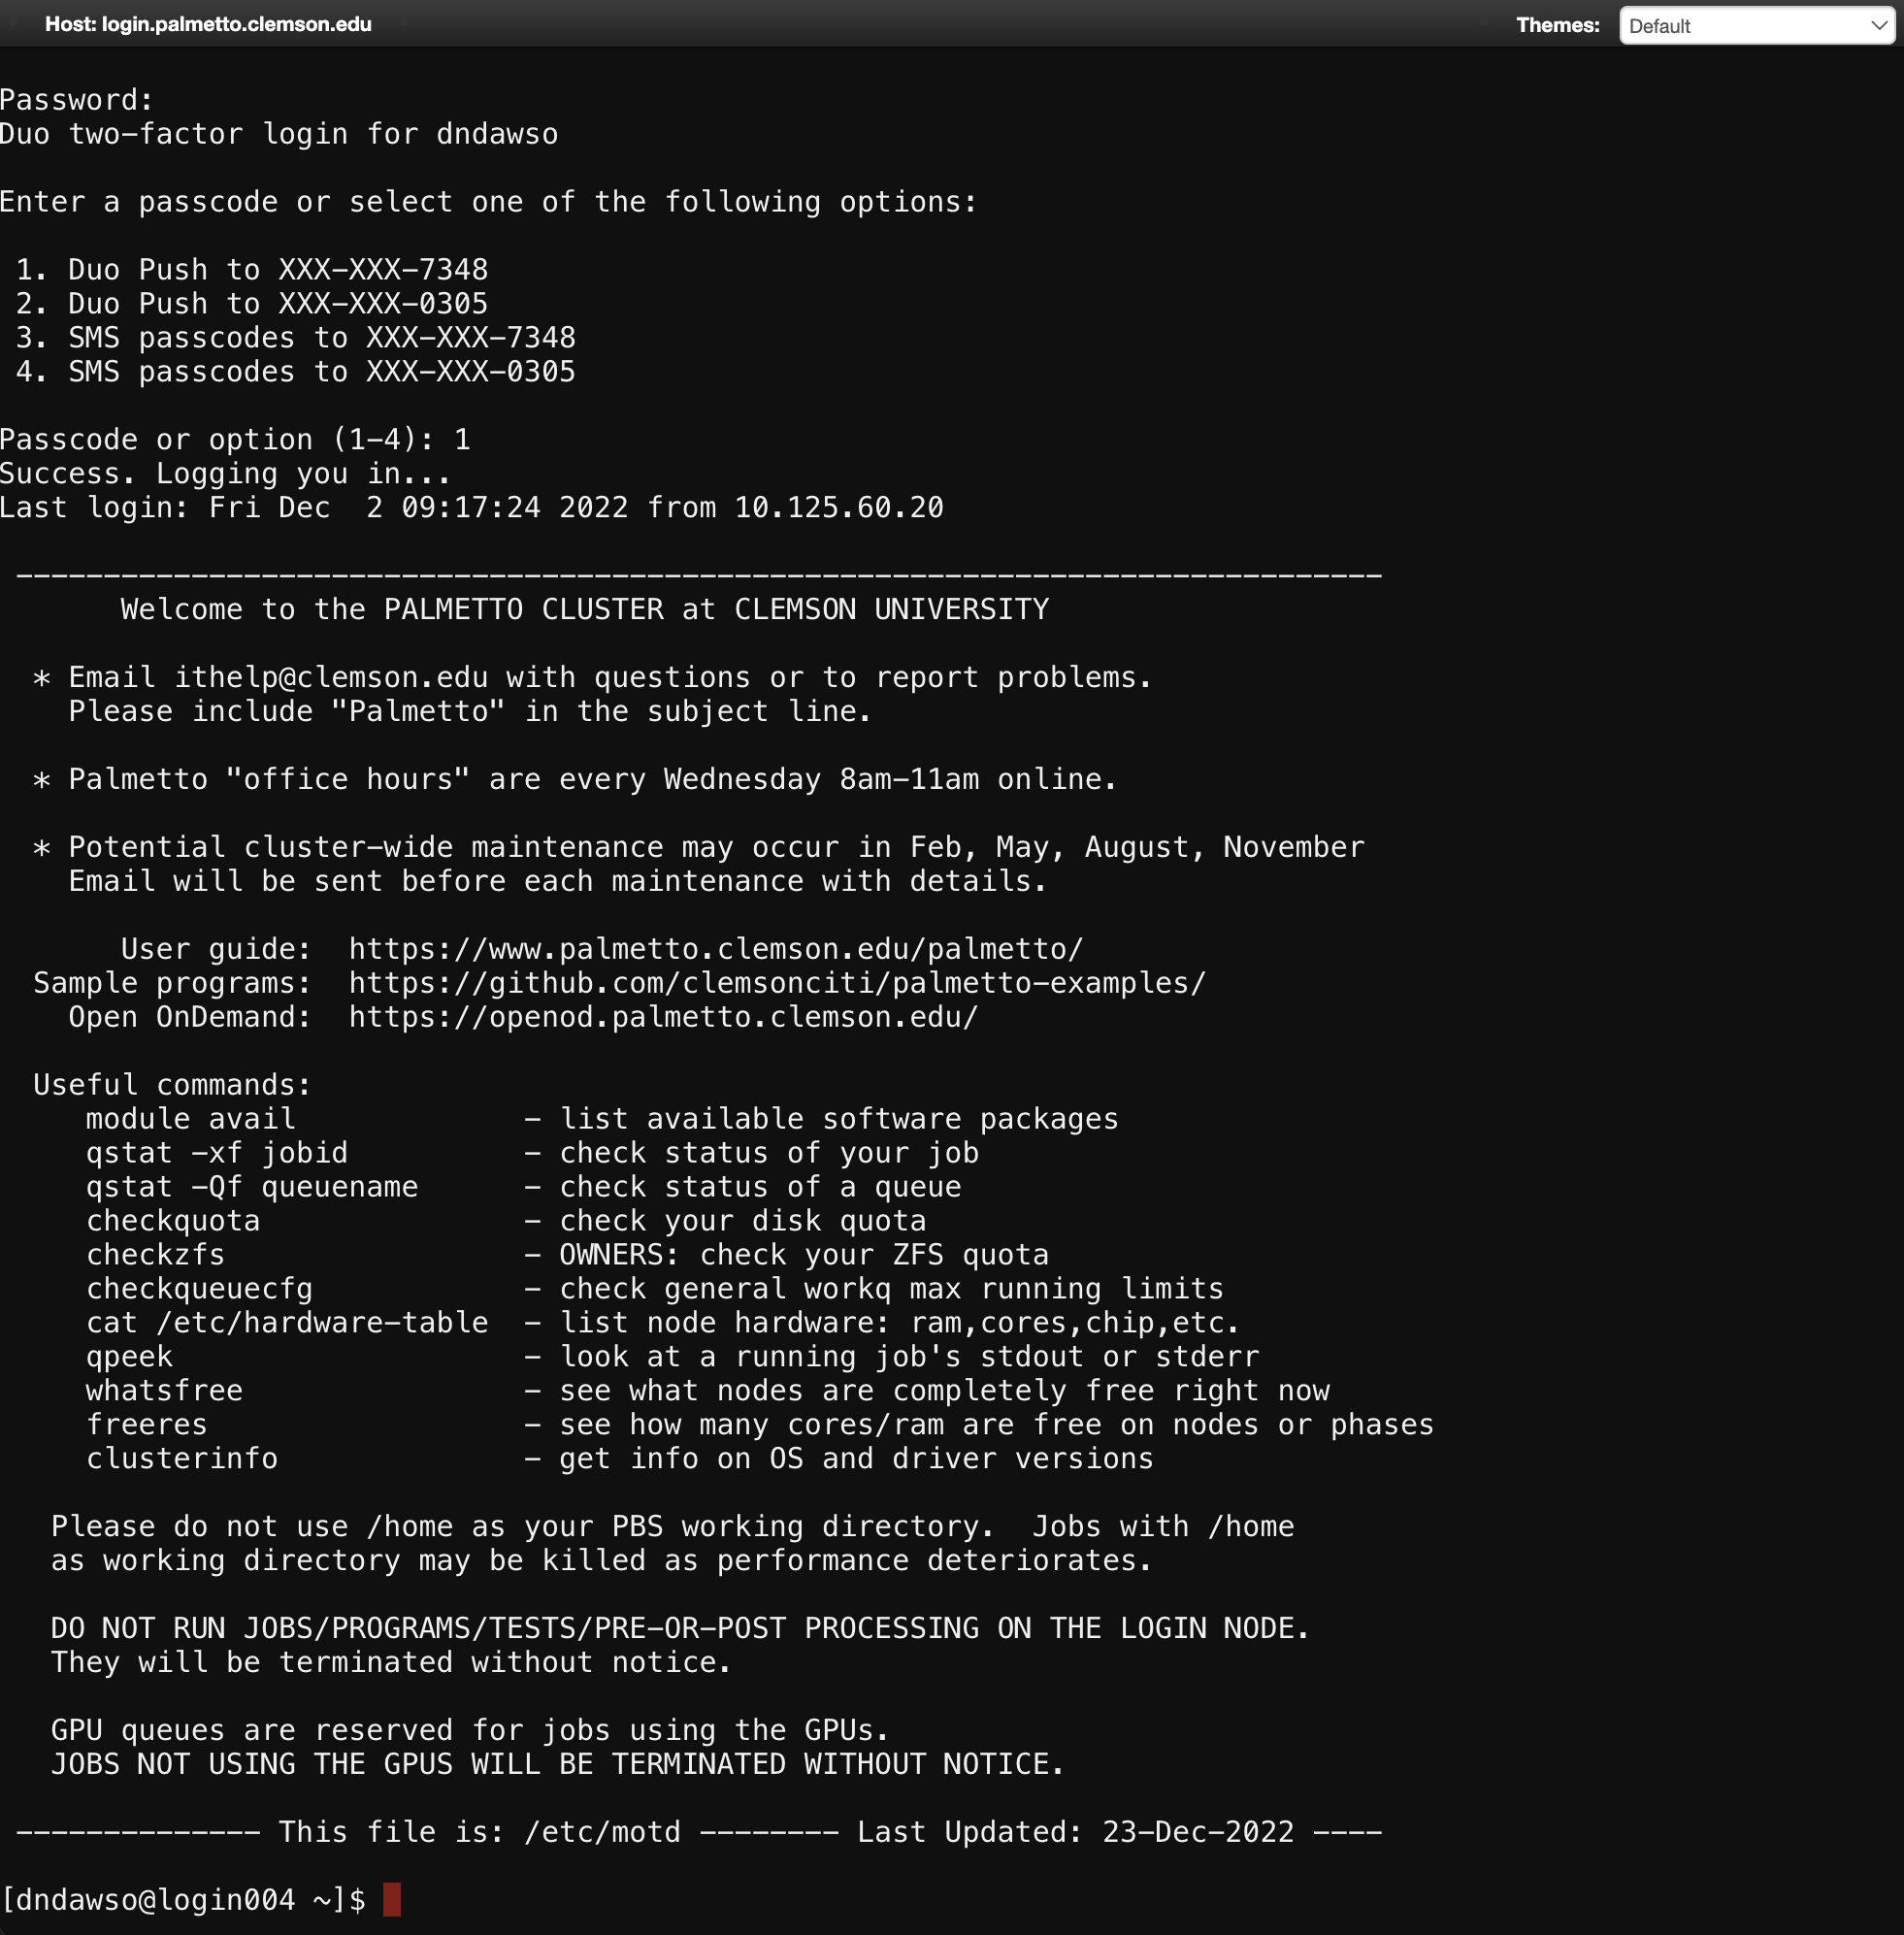
From here, you can run scripts on the login node (such as checkquota,
checkqueucfg, whatsfree), and request compute nodes with salloc.
There is currently an idle timeout that happens when you use the shell access feature of Open OnDemand. If you are inactive for a period of time, the shell will need to be restarted.
Jupyter Notebook
You can use OpenOD to run certain applications like Jupyter and Tensorflow notebooks, R Studio, and Matlab. Let's run Jupyter. From "Interactive apps", please select "Jupyter Notebook":

Please fill out the request as shown on this picture:
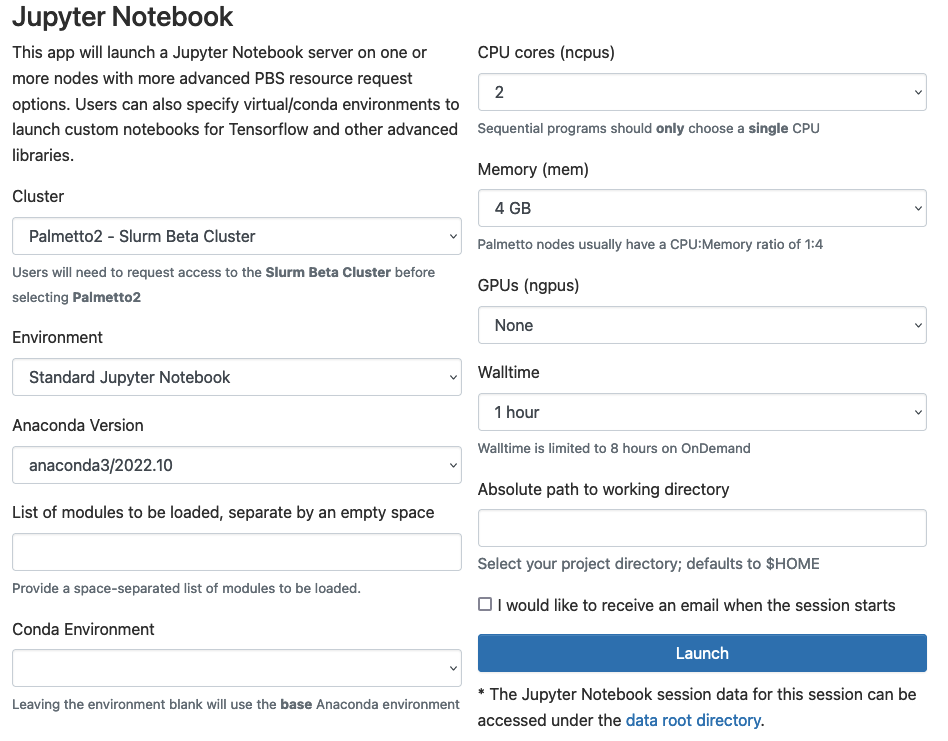
Environment: Leave as Standard Jupyter Notebook.Anaconda Version: Leave as default.List of modules...: Leave blank.Conda Environment: Leave blank.CPU cores: Select 2.Memory: Select 4 GB.GPUs: Select 'None'.Walltime: Select 1 hour.Absolute path: Leave blank.
This is basically a graphical interface to salloc. You are asking for 1
compute node, 1 CPUs, 4 GB of memory, 1 GPU, for the walltime duration of 0.5
hour. Once you are done entering this information, please click the blue
"Launch" button at the bottom. It will bring out a new screen:
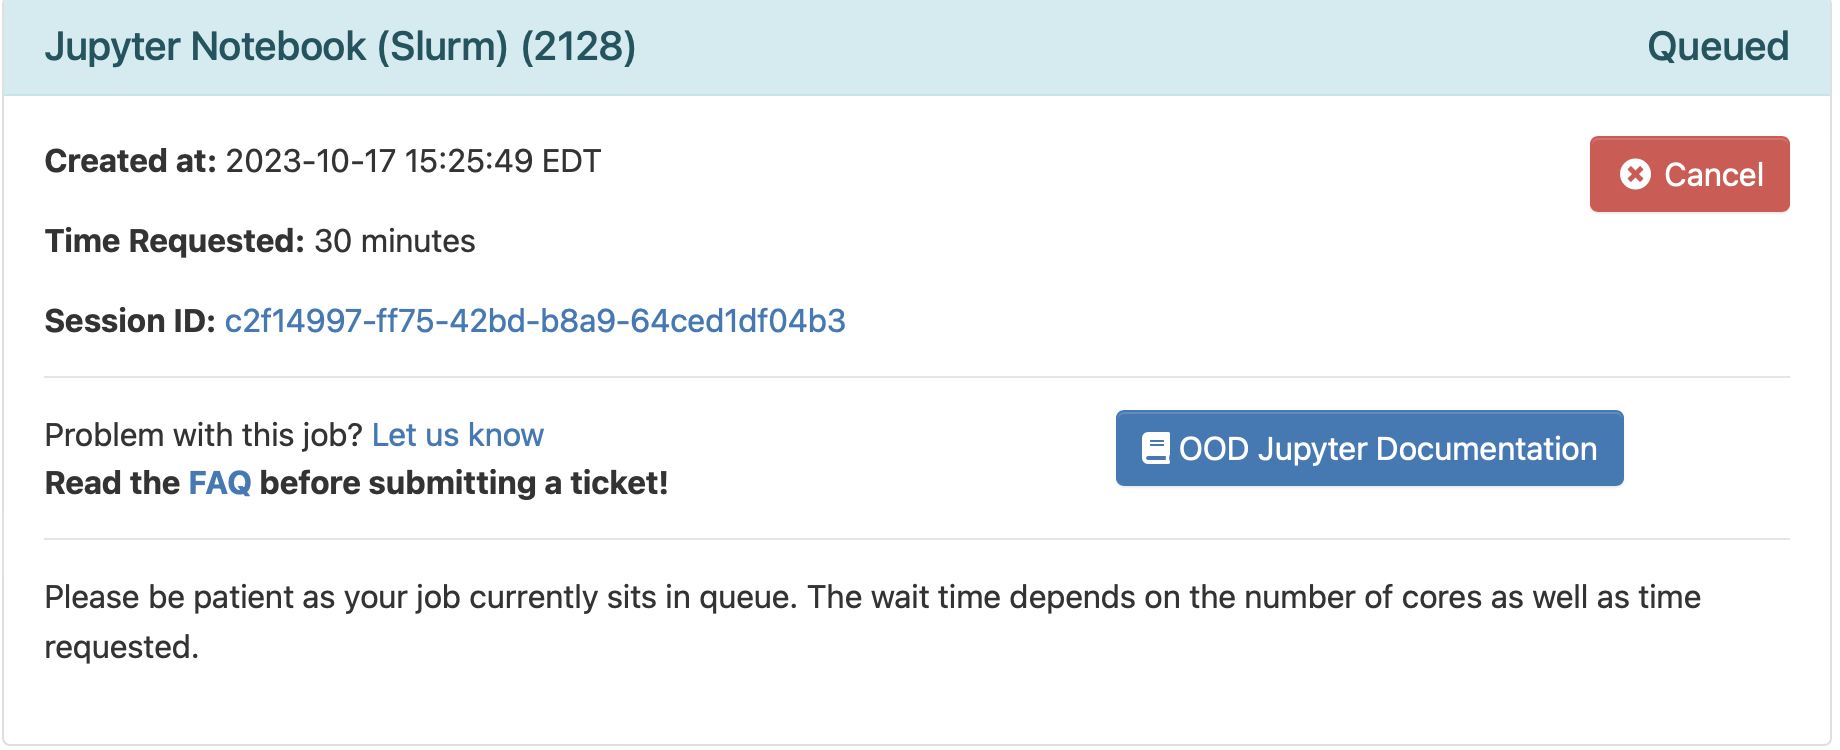
This means your request is being processed. Once the compute node is ready, you will see a blue button under your request saying "Connect to Jupyter":
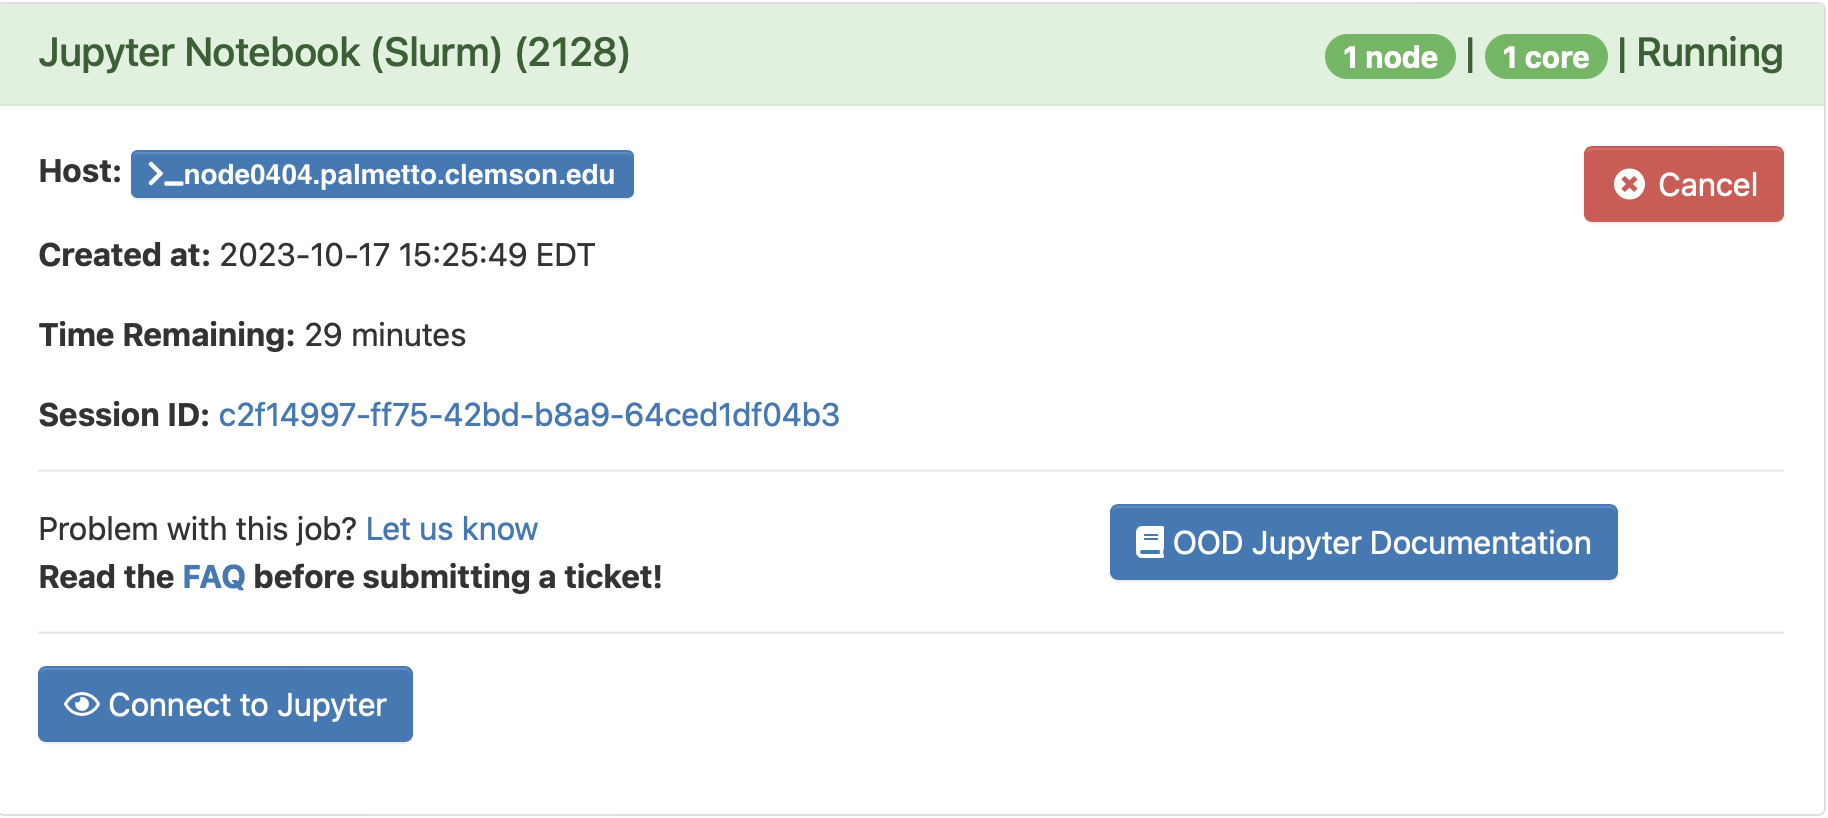
Click on it, and it will start Jupyter.
We won't go further into Jupyter notebooks at this workshop. To exit the interactive app, you can close the browser tab, but that won't stop the underlying job. Those resources will still be locked. To stop the job, select the "my interactive sessions" icon at the top:

You should then press the cancel button on the session you are done with. This releases the resources back to the cluster so that others can use them.